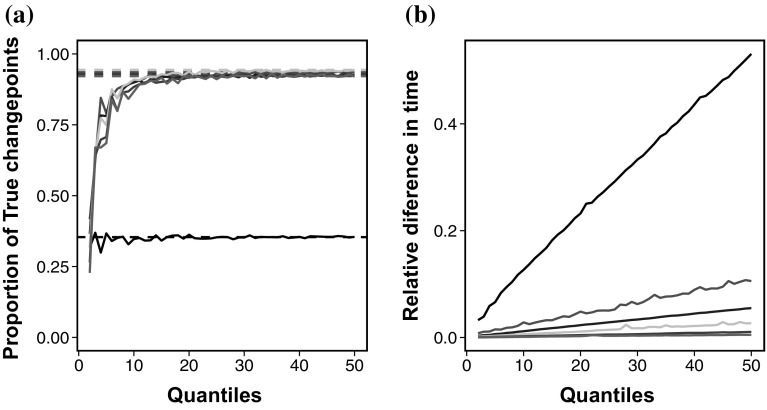
Fig. 2.
a The proportion of true positive changepoints for a range of quantiles, K, in ED-PELT (solid) in comparison to ED-PELT (dashed). Black , red , blue: , grey and dark green . b Relative speed of using ED-PELT compared to using ED-PELT. with varying number of quantiles, K. Black , red , blue , grey , dark green and purple n =10,000. (Color figure online)

