Fig. 4.

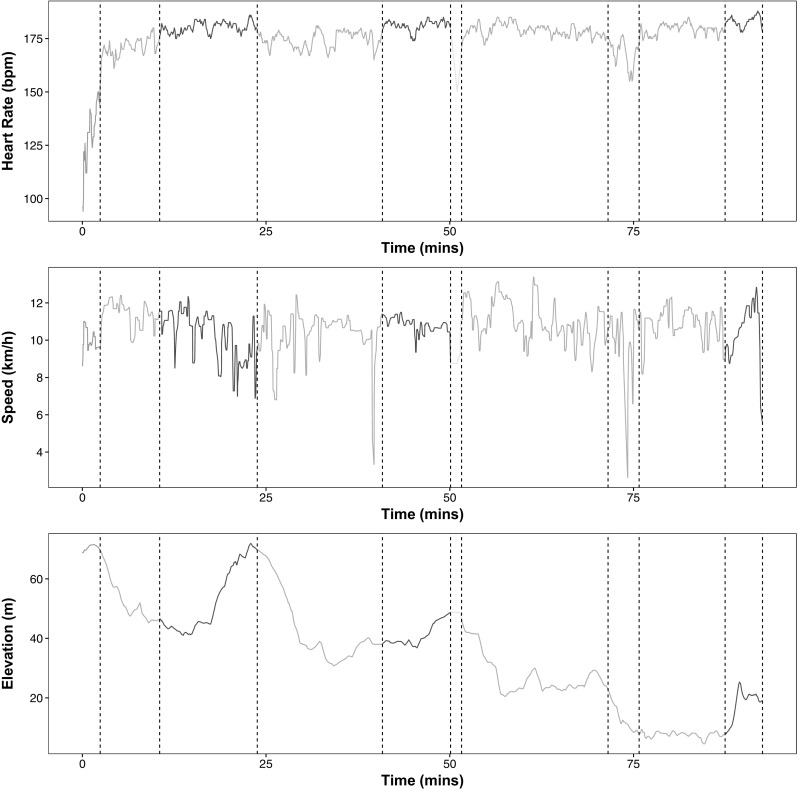
Segmentations using ED-PELT with 10 changepoints. We have colour coded the line based on the average heart-rate of each segment where red peak, orange anaerobic, yellow aerobic and green recovery. (Color figure online)

Segmentations using ED-PELT with 10 changepoints. We have colour coded the line based on the average heart-rate of each segment where red peak, orange anaerobic, yellow aerobic and green recovery. (Color figure online)