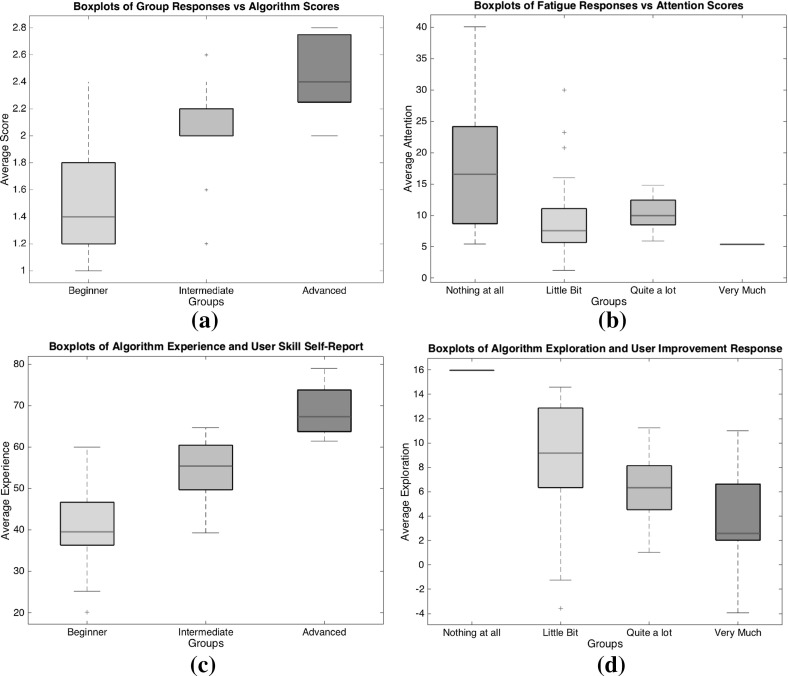
Fig. 11.
a Boxplots of the average score of track altering decision of each user against their skill response. Kruskal–Wallis test shows statistically significant results: , . Whereas Spearman Correlation: , p value shows a strong positive correlation. b Boxplots of the average score Attention of each user against their response on fatigue. Kruskal–Wallis test shows statistically significant results: , . Spearman Correlation detects a negative correlation: , . c Boxplots of the average score on Experience of each user against their response on self-reported skill. Kruskal–Wallis test shows statistically significant results: , . Spearman Correlation gives a strong positive correlation: , . d Boxplots of the average score on Exploration of each user against their response on improvement. Kruskal–Wallis test shows statistically significant results: , . Whereas Spearman correlation shows a negative correlation: ,

