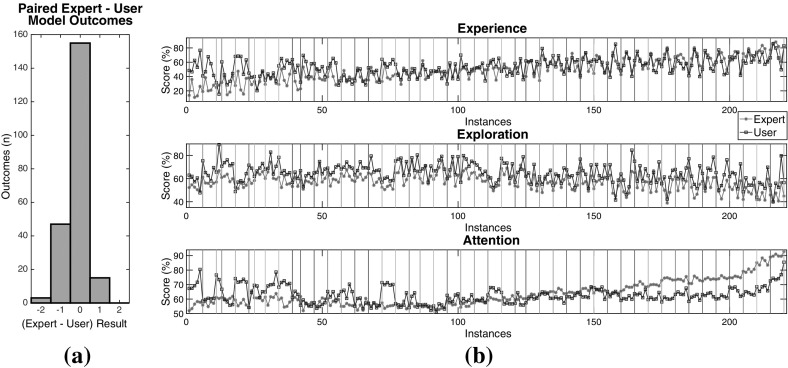
Fig. 12.
a Comparison of the ordinal outputs between models using expert and user data comparisons. Wilcoxon signed rank (two-tailed) test gives and p value , as some of the outcomes shifted towards higher levels. b Outputs of high level variables of the two models using expert and user’s “best” data comparisons. The boundaries between the vertical lines indicate the results from different users. For all the variables and for each user, the trends are similar (some differ with a fixed bias per user). Therefore, the difference in results is because the model is overconfident for the abilities of each user and the particular thresholds chosen

