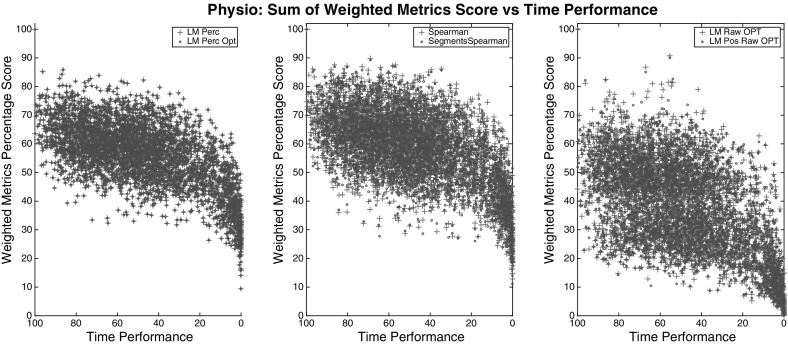
Fig. 5.
Outcomes of different models for group Physio. Between the models tested, LM Perc provides the best weights for a linear correlation between the combined physio metrics and the time performance. LM Perc and LM Perc Opt have identical correlations () since the latter only corrected some peaks in the values

