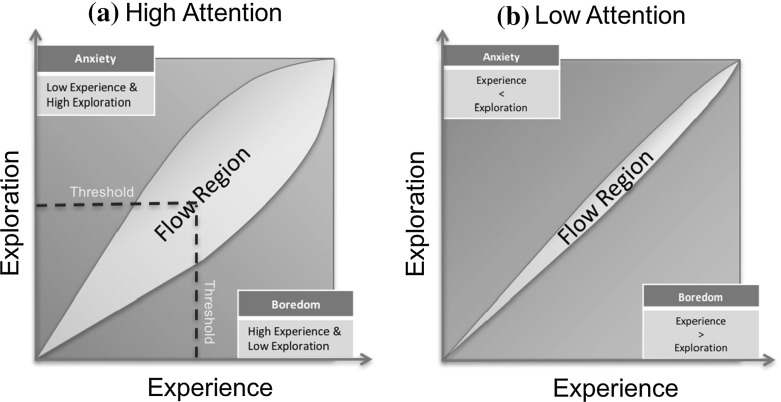
Fig. 7.
The two figures show how the area of the region of flow reduces between high and low Attention. The flow region defines the optimal region for user engagement. In the low attention case, the region of flow becomes narrower and the user model’s variables are compared between themselves than to the threshold parameters

