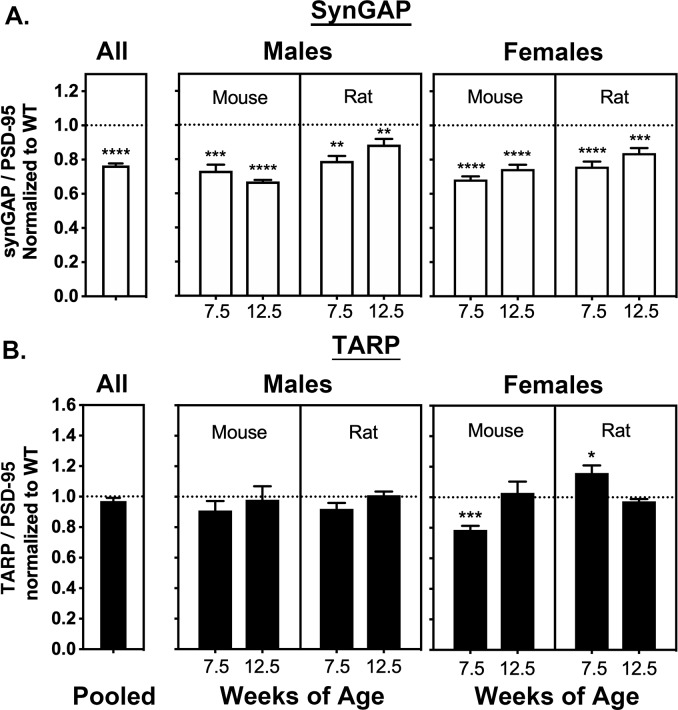
Figure 2. Averaged ratios of synGAP and TARPs to PSD-95 in PSDs from WT and HET Rats and Mice.
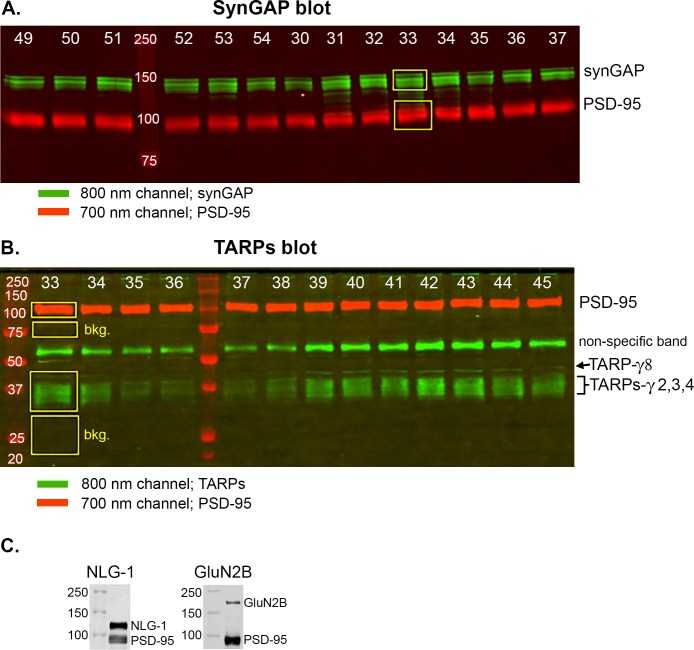
PSDs were purified from the brains of individual animals as described under Materials and methods. The ratios of synGAP to PSD-95 (A) and TARPs to PSD-95 (B) were determined as described under Materials and methods and in Figure 2—figure supplement 1. Ratios from HET animals (bars) are normalized to the ratios from WT animals (dotted lines). Antibodies against synGAP, TARPS, and PSD-95 are the same as those used in Walkup et al. (2016). The antibody against synGAP (AB_2287112) recognizes all isoforms of synGAP. The antibody against TARPs (AB_877307) recognizes TARP-γ2, γ3, γ4, and γ8. The sample sizes for each group and the significance tests are as follows. A) all animals WT = 79 and HET = 78, one-tailed Wilcoxon matched-pairs signed rank test; male mouse 7.5 weeks WT = 11 and HET = 9, one-tailed Student T-test; male mouse 12.5 weeks WT = 11 and HET = 8, one-tailed Student T-test with Welch’s correction; male rat 7.5 weeks WT = 11 and HET = 10, one-tailed Student T-test; male rat 12.5 weeks WT = 10 and HET = 11, one-tailed Student T-test; female mouse 7.5 weeks WT = 10 and HET = 12, one-tailed Student T-test with Welch’s correction; female mouse 12.5 WT = 9 and HET = 9, one-tailed Student T-test; female rat 7.5 weeks WT = 10 and HET = 10, one-tailed Student T-test; female rat 12.5 weeks WT = 9 and HET = 10, one-tailed Student T-test. B) all animals WT = 77 and HET = 80, two-tailed Wilcoxon matched-pairs signed rank test; male mouse 7.5 weeks WT = 10 and HET = 9, two-tailed Student T-test; male mouse 12.5 weeks WT = 10 and HET = 10, two-tailed Mann Whitney test; male rat 7.5 weeks WT = 10 and HET = 10, two-tailed Student T-test; male rat 12.5 weeks WT = 10 and HET = 1, two-tailed Student T-test; female mouse 7.5 weeks WT = 9 and HET = 10, two-tailed Student T-test; female mouse 12.5 WT = 9 and HET = 10, two-tailed Mann Whitney test; female rat 7.5 weeks WT = 10 and HET = 10, two-tailed Student T-test; female rat 12.5 weeks WT = 9 and HET = 10, two-tailed Student T-test with Welch’s correction. Significance: * for p≤0.05, ** for p≤0.01, *** for p≤0.001, and **** for p≤0.0001.


