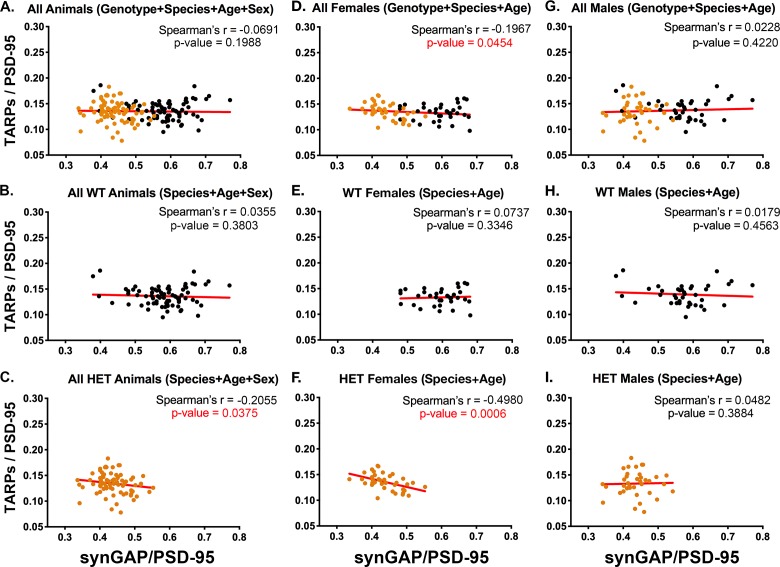
Figure 3. Correlation of the ratios TARPs/PSD-95 and synGAP/PSD-95 among individual animals.
Each point represents mean ratios for a single animal. Corrected ratios and Spearman’s rank correlation coefficients were determined as described under Materials and methods. (A) All animals, including all genotypes, ages, species, and sexes; n = 152. (B) All WT animals, including all ages, species, and sexes; n = 76. (C) All HET animals, including all ages, species, and sexes; n = 76. (D) All female animals, including all genotypes, ages, and species; n = 75. (E) All WT females including all ages and species; n = 36. (F) All HET females, including all ages and species; n = 39. (G) All male animals, including all genotypes, ages, and species; n = 77. (H) All WT males, including all ages and species; n = 40. (I) All HET males, including all ages and species; n = 37. Black symbols, WT; Orange symbols, HET. P-values for Spearman’s rank correlation coefficient are one-tailed. Significant p-values are shown in red.


