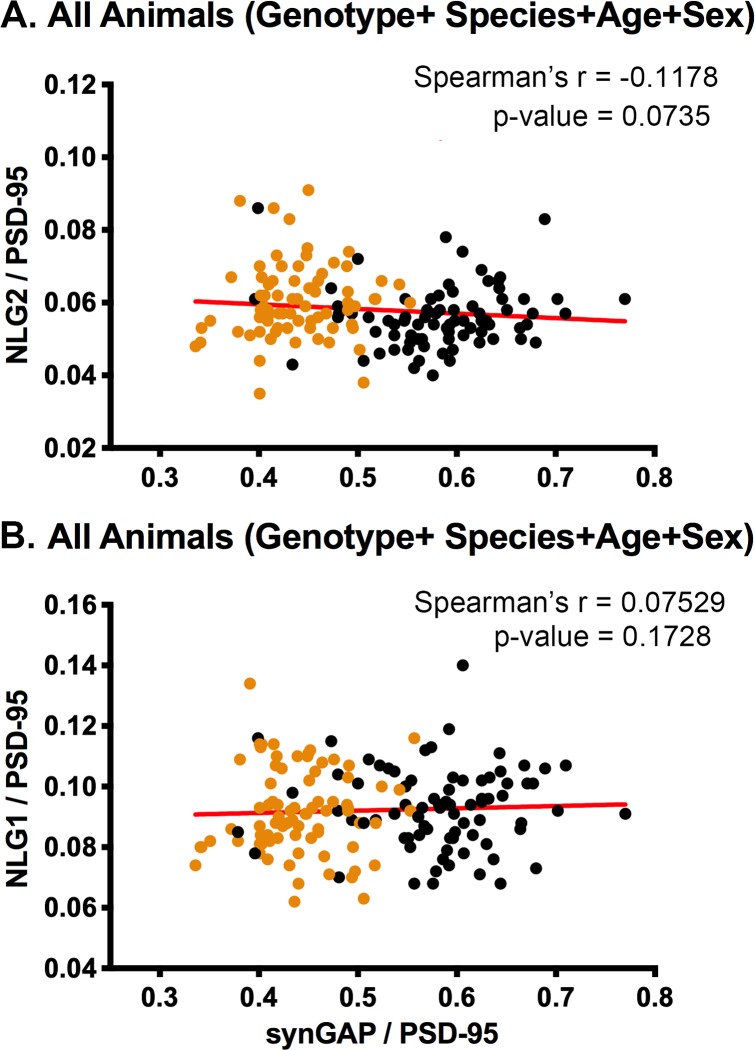
Figure 6. Correlation of the ratios of NLG-2/PSD-95 or NLG-1/PSD-95 and synGAP/PSD-95 for individual animals.
Each point represents a single animal. Black, WT; Orange, HET. (A) Correlation of NLG-2/PSD-95. All animals, including all genotypes, ages, species, and sexes. n = 153. (B) Correlation of NLG-1/PSD-95. All animals, including all genotypes, ages, species, and sexes. n = 159. P-values of Spearman’s rank correlation coefficient indicate no significant correlation.

