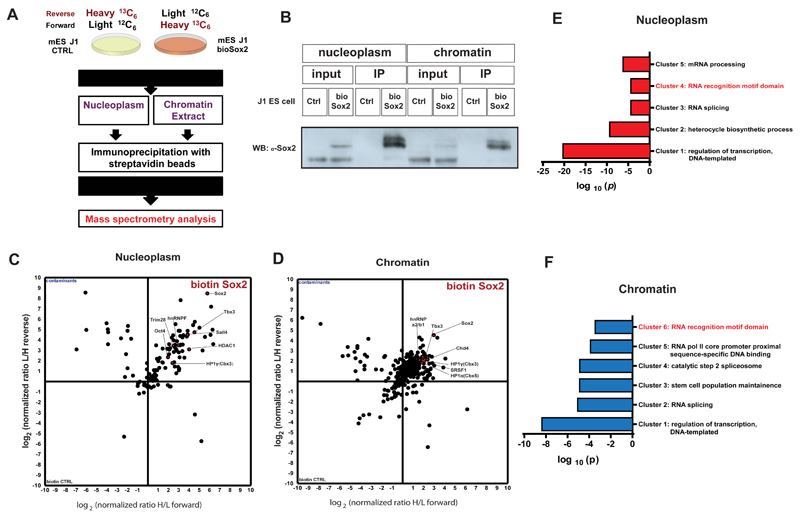
Figure 1.
A) Schematic representation of the strategy used to characterize Sox2 protein interactome by Stable Isotope Labelling by Amino acids in Cell culture (SILAC) followed by Mass spectroscopy (MS). Control and bioSox2 J1 ES cell lines were cultured with either LIGHT (12C6) or HEAVY (13C6) medium, respectively. Native chromatin and nucleoplasm extracts were prepared from these cells and the protein interactome of Sox2 was immunoprecipitated and mixed prior to MS for proteomic analysis.
B) Western blot showing successful pull down and an enrichment of bioSox2 after immunoprecipitation in both chromatin and nucleoplasm fractions, compared to the control.
C) 2D interactome plot representing the fold change of identified proteins interacting with bioSox2 in the nucleoplasm. Ratios are represented in a logarithmic scale with (H/L) on X axis plotted against (L/H) on Y.
D) 2D interactome plot representing the fold change of identified proteins interacting with bioSox2 in the chromatin. Ratios are represented in a logarithmic scale with (H/L) on X axis plotted against (L/H) on Y.
E) Gene Ontology (GO) analysis for significant protein interactors of Sox2 in the nucleoplasm fraction of J1 ES cells. Represented in the figure are the non-redundant GO terms found over-represented by modified Fisher exact test with Bonferroni corrected P-values
F) GO analysis for significant protein interactors of Sox2 in the chromatin fraction of J1 ES cells. Represented in the figure are the non-redundant GO terms found over-represented by modified Fisher exact test with Bonferroni corrected P-values.

