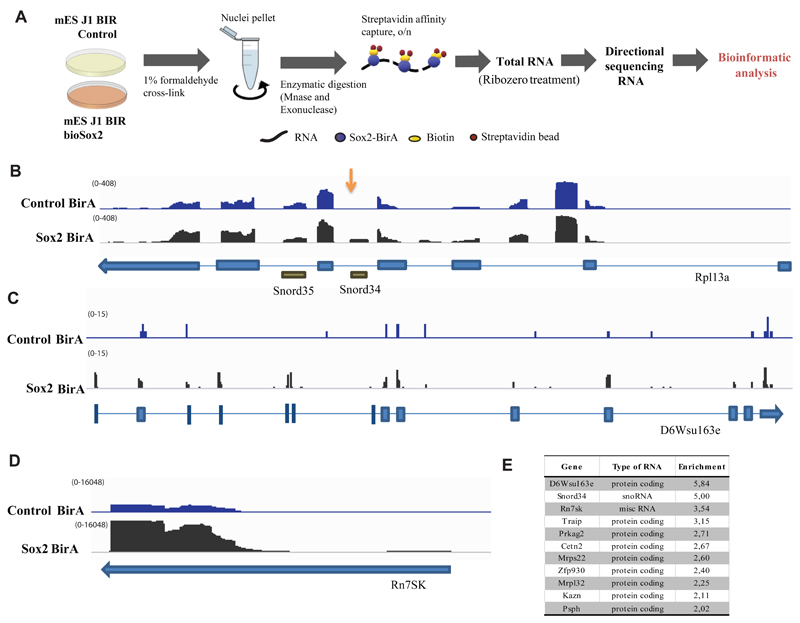
Figure 2.
A) Schematic representation of the strategy used to characterize RNA interactome of Sox2 by RNA-immunoprecipitation followed by sequencing (RIP-seq). Cells from control and bioSox2 J1 ES cell line were fixed with 1 % formaldehyde to capture direct and indirect RNA-bioSox2 interactions. Nuclei were pelleted and RNA was enzymatically digested. BioSox2-bound RNA was immunoprecipitated with streptavidin beads and the final eluted RNA was Ribo-Zero treated to remove ribosomal RNA, before sequencing.
B) IGV screenshot of Rpl13a gene from one RIP-Seq experiment showing normalized read counts from sequenced RNA in control and Sox2-BirA (bioSox2) samples, following RIP-seq. Snord34 reads are over-represented in bioSox2 compared to the control (indicated by an arrow). Neighboring Snord35 does not show any such over-representation.
C) IGV screen shot of D6Wsu163e gene from one RIP-Seq experiment showing normalized read counts from sequenced RNA in control and Sox2-BirA (bioSox2) samples, following RIP-seq. D6Wsu163e reads are over-represented in bioSox2 compared to the control sample.
D) IGV screen shot of Rn7SK gene from one RIP-Seq experiment showing normalized read counts from sequenced RNA in control and Sox2-BirA (bioSox2) samples, following RIP-seq. Rn7SK reads are over-represented in bioSox2 compared to the control sample.
E) Table showing all RNAs with enrichment ratio > 2 and bioSox2 RIP raw read count > 50 in two RIP-seq experiments combined. Enrichment ratios were computed as (bioSox2 RIP / ctrl RIP) / (bioSox2 input / ctrl input), using normalized counts incremented by a pseudo-count of 0.1 (to avoid denominators of zero). For more details, see Supplementary Table 4.

