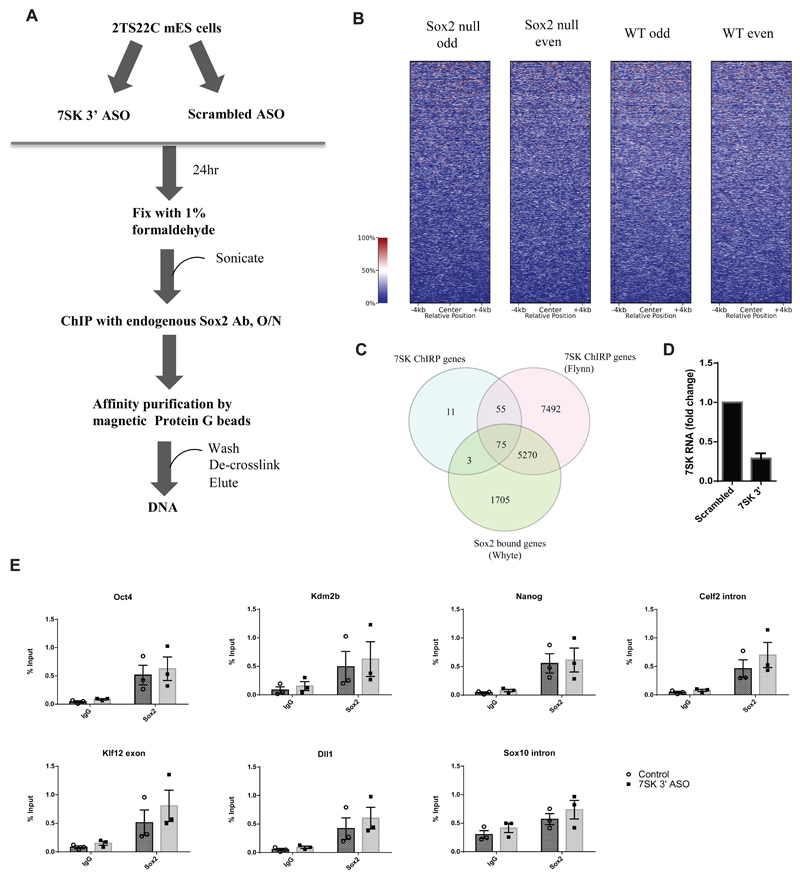
Figure 4.
A) Schematic representation of a Chromatin immunoprecipitation (ChIP) experiment following 7SK knock down in 2TS22C mES cells. An ASO targeting 3’ end of 7SK was used to knock down 7SK. Control cells were treated with a scrambled ASO. The resulting cells were fixed with 1% formaldehyde, sonicated, and chromatin from about 100,000 cells was used for immunoprecipitation with an antibody against endogenous Sox2. This was followed by affinity purification of immune complexes with Protein G beads. The DNA was de-crosslinked and eluted prior to qPCR analysis.
B) Normalized ChIRP-seq read distribution centered on the Sox2 binding peaks from Whyte et al. dataset shows no co-binding of 7SK at Sox2-bound loci.
C) Venn diagram showing an overlap of genes among three datasets, namely Sox2 ChIP Whyte dataset, 7SK ChIRP Flynn dataset and the ChIRP dataset produced in this study. The numbers in the intersections denote the number of unique genes associated with each factor, either in the gene body or in the promoter.
D) RT-qPCR showing fold change in 7SK expression 24 h post-transfection with 100 nM of 7SK 3’ ASO compared to the control treated with a scrambled ASO. Error bars indicate SEM (n=3)
E) ChIP-qPCR results showing enrichment of Sox2 bound DNA as percent input in 2TS22C cells treated with control and 7SK 3’ ASO at regulatory regions of Pou5f1 (Oct4), Nanog, Kdm2b, Celf2, Klf12 and Dll1. Amplification in goat IgG was used as a measure of background for the specific regions assayed. Sox10 intron was used as a negative control. Error bars indicate SEM (n=3), each point is a biologically independent experiment (knock-down) that represents an average of triplicate or duplicate ChIP experiments.

