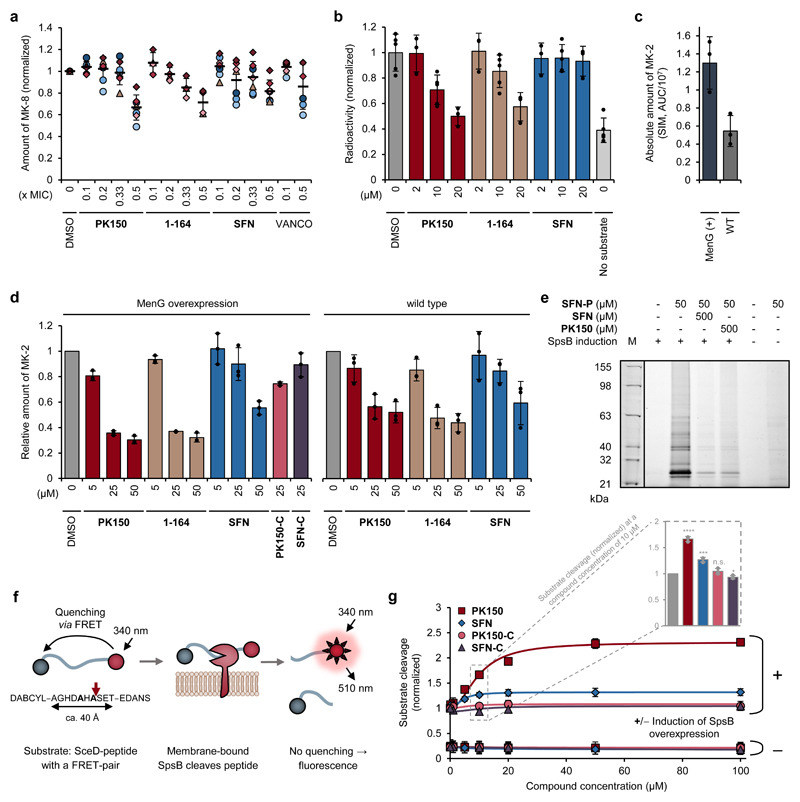
Figure 3. Validation of cellular targets with putative roles in the antibiotic mechanism.
(a) Metabolic profiling of endogenous menaquinone levels in S. aureus NCTC 8325 cells upon compound treatment. Bacteria were treated with sub-inhibitory concentrations (0.1-fold to 0.5-fold the respective MIC) of PK150, 1-164, SFN or vancomycin (VANCO). Menaquinone-8 (MK-8) was extracted by solid phase extraction and quantified by LC-MS, using single ion monitoring and menaquinone-9 as internal standard. MK-8 levels are normalized to DMSO-treated samples. Each colour represents an individual independent extraction experiment, where differently shaped symbols (circles, triangles, diamonds) indicate independent biological samples. Error bars denote mean values ± SD (n = 7 for PK150, SFN; n = 4 for 1-164; n = 6 for VANCO).
(b) Radioactive enzymatic assay monitoring the transfer of the radiolabelled methyl group of S-adenosyl-l-methionine ([3H]SAM) to demethylmenaquinone-2 (DMK-2). Cellular lysate of S. aureus pRMC2-MenG (20 mg/mL total protein concentration) was incubated with [3H]SAM, DMK-2, and different concentrations of PK150, 1-164 or SFN. After 80 min incubation time, menaquinone was extracted with hexane/2-propanol 3:2 and the radioactivity in the organic phase measured by liquid scintillation counting. “No substrate” indicates the background activity in the absence of DMK-2. Values represent mean ± SD of independent replicates (n = 5 for DMSO, 10 μM conditions and no substrate; n = 3 for 2 μM and 20 μM conditions) and are normalized to the DMSO-treated control.
(c and d) Enzymatic assay monitoring the methylation of demethylmenaquinone-2 (DMK-2) by LC-MS. Cellular lysate of either S. aureus pRMC2-MenG or S. aureus NCTC 8325 (20 mg/mL total protein concentration) was treated with S-adenosyl-l-methionine, DMK-2 and different concentrations of PK150, 1-164, SFN or respective controls (SFN-C, PK150-C). After 80 min incubation time, menaquinones were extracted by solid phase extraction and production of menaquinone-2 (MK-2) was quantified by LC-MS, using single ion monitoring (SIM) with menaquinone-4 (MK-4) as internal standard. MenG-overexpressing strain pRMC2-MenG (MenG(+)) produces more MK-2 compared to the wild type NCTC 8325 (WT), as indicated by the total area under the curve (AUC) ± SD, n = 3, of the SIM peak of MK-2 (c). MK-2 quantities were normalized to the respective DMSO-treated samples and represent the averaged values ± SD from three independent experiments (d).
(e) Labelling of recombinant SpsB. Fluorescence gel shows labelling patterns after pretreatment of E. coli BL21(DE3)pLysS cells harbouring pET-55-DEST-SpsB (either induced (+) or not induced (-) for expression of SpsB (MW 24951 Da)) with DMSO (control), SFN or PK150 (500 μM; competition) and subsequent incubation with SFN-P (50 μM). Note that two lanes representing purified SpsB were omitted for clarity and are depicted in Supplementary Fig. 12 together with the corresponding Coomassie stain. The gel is representative for two independent experiments.
(f) Schematic representation of the fluorescence resonance energy transfer (FRET)-assay for measuring the activity of membrane-bound SpsB via the cleavage of a FRET-peptide substrate. The FRET-peptide substrate is based on the signal peptide sequence of Staphylococcus epidermidis SceD preprotein modified with the fluorescent donor 5-((2-aminoethyl)amino)-1-naphthalenesulfonic acid (EDANS) and the quenching acceptor 4-((4-(dimethylamino)phenyl)azo)benzoic acid (DABCYL).
(g) SFN- and PK150-induced concentration-dependent cleavage of the FRET-substrate by membrane-bound SpsB (50 μg/mL total membrane protein concentration). Substrate cleavage rates are normalized to DMSO-treated samples from the induced membranes. Membranes were extracted from E. coli BL21(DE3)pLysS cells harbouring pET-55-DEST-SpsB (either induced (+) or not induced (-) for expression of SpsB). Bars highlight SpsB activity at 10 μM compound concentration relative to DMSO. All data represent mean values ± SD of averaged triplicates of n = 3 biologically independent experiments per group; n.s., not significant, p = 0.2023; *, p = 0.0249; ***, p = 0.00045; ****, p = 1.76 ⋅ 10-5 (two-sided unpaired parametric t-test) for compound- vs. DMSO-treated groups.

