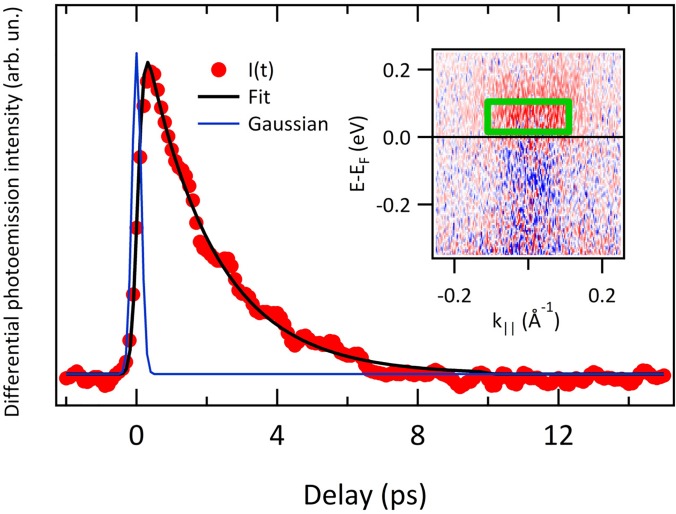
FIG. 7.
Electron dynamics acquired in the pump-probe experiment. Photoemission intensity has been averaged in the green box overlaid on the ARPES map reported as the inset, which shows the differential ARPES intensity collected at the delay t = 300 fs. The black line in the main panel is the fit to the data (see main text for details). Blue line is the Gaussian representing the pump-probe cross correlation, as retrieved by the fitting routine.

