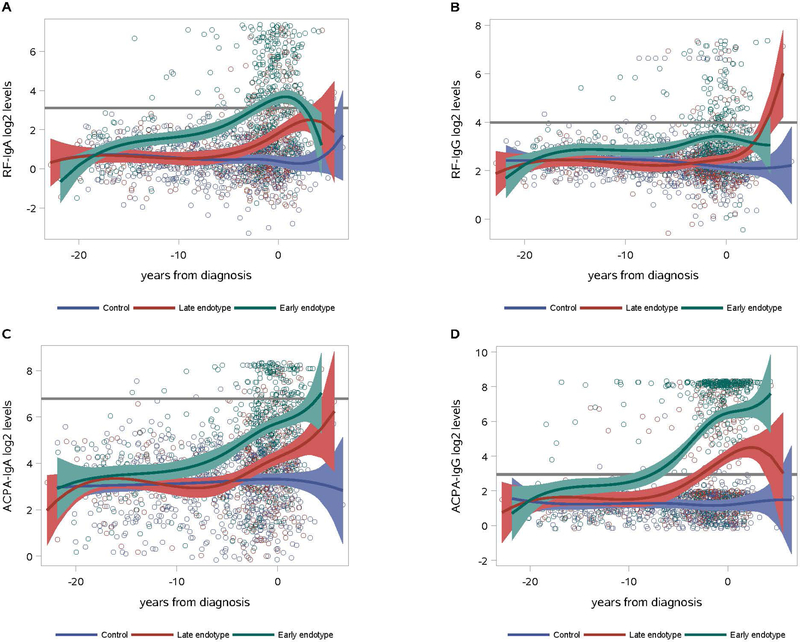
Figure 2. Two endotypes identified among RA cases based on trajectories of autoantibody isotypes.
In the ‘early’ endotype (116 RA cases, green lines), RF and ACPA IgG and A autoantibodies began to increase from controls (blue lines) early in the pre-RA period (Figure 2A-D). RF-IgM and ACPA-IgM trajectories are not pictured but are within the range of IgG and A autoantibodies for each endotype. In contrast, in the ‘late’ endotype (98 cases, red lines) RF and ACPA IgG and A autoantibodies showed an increase from controls (blue lines) just proximal to the diagnosis of RA (Figure 2A-D, red lines).

