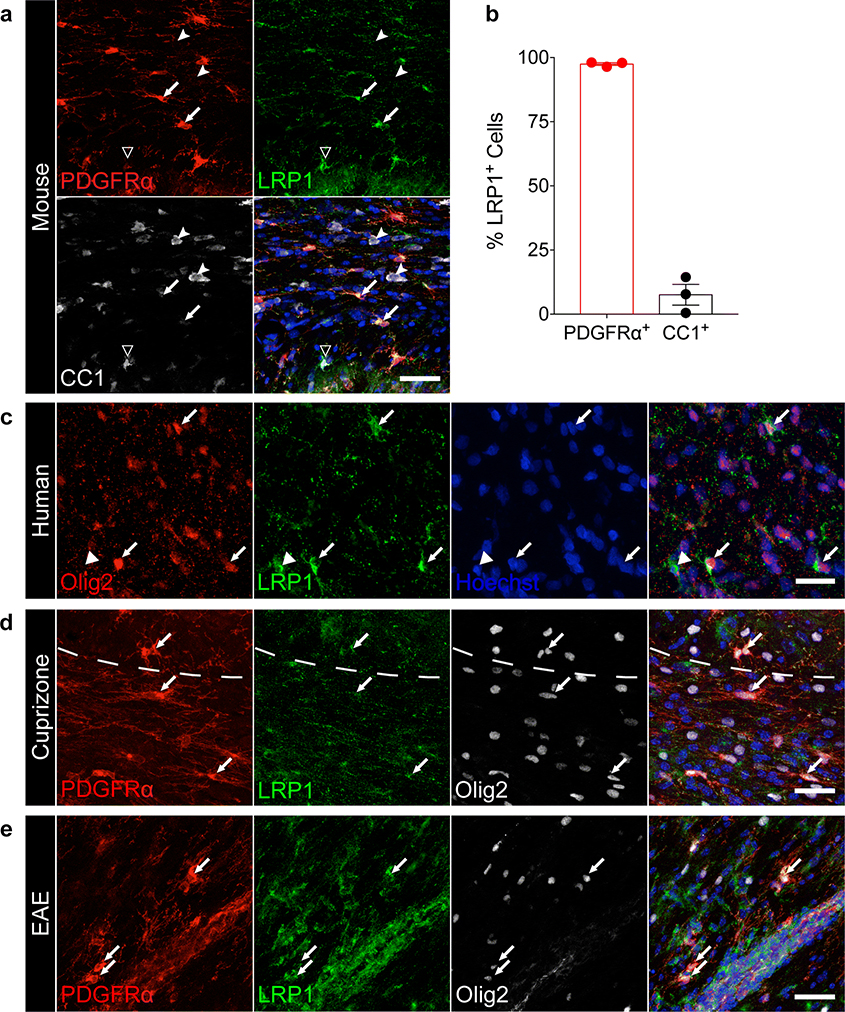
Fig. 1. LRP1 is dynamically expressed in oligodendroglia in the homeostatic and pathological CNS.
(a) Staining in the adult mouse corpus callosum for PDGFRα, LRP1, and CC1 (arrows = PDGFRα+ LRP1+ cells; dented arrowheads = CC1+ LRP1− cells; hollow arrowhead = CC1+ LRP1+ cell). Scale bar 40μm. (b) Quantification of PDGFRα+ and CC1+ cells expressing LRP1 in the adult mouse corpus callosum (n=3 mice; error bars represent +/− SEM). (c) Human white matter stained for Olig2 and LRP1 (arrows = Olig2+ LRP1+ cells; arrowheads = Olig2− LRP1+ cells). Scale bar 20μm. (d) Staining for PDGFRα, LRP1, and Olig2 in the mouse corpus callosum after cuprizone-induced demyelination (arrows = PDGFRα+ LRP1+ Olig2+ cells). Dashed line demarcates the border between the cortex and corpus callosum. Scale bar 30μm. (e) EAE spinal cord stained for PDGFRα, LRP1, and Olig2 (arrows = PDGFRα+ LRP1+ Olig2+ cells). Scale bar 40μm.

