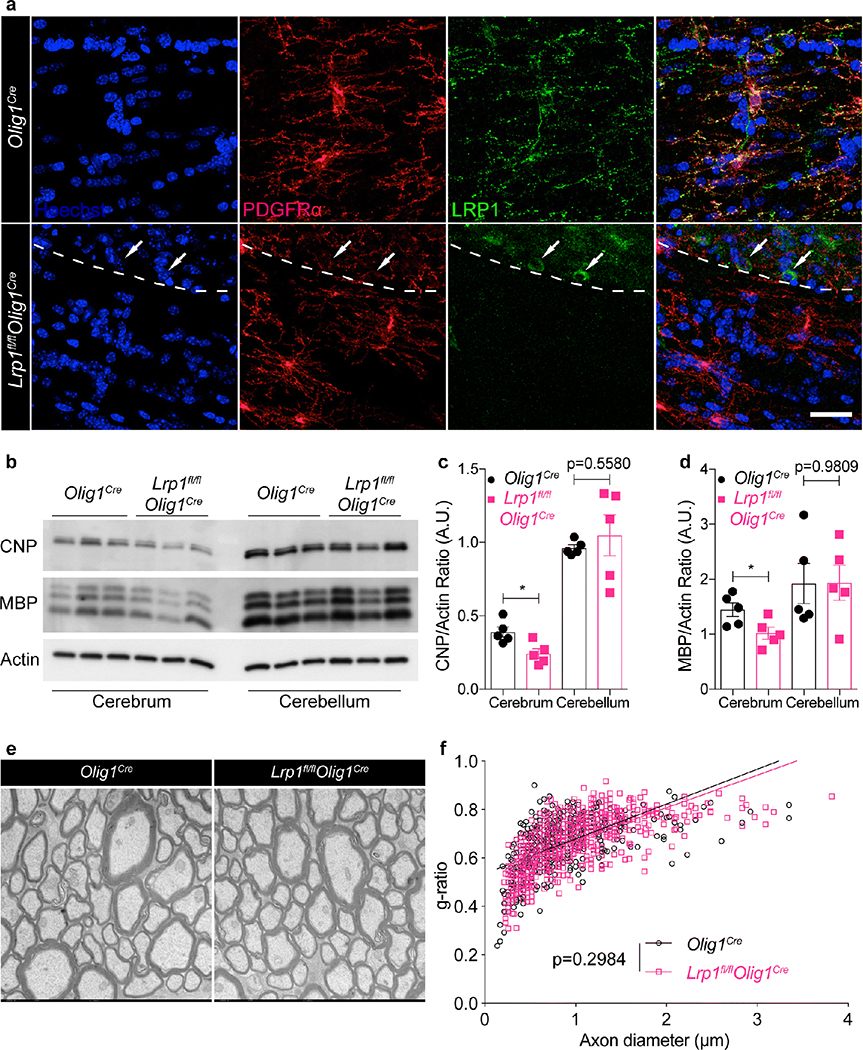
Fig. 2. Deletion of LRP1 in OPCs is not associated with severe myelin defects.
(a) Staining for PDGFRα and LRP1 in the corpus callosum in Olig1cre and Lrp1fl/flOlig1cre mice (arrows = LRP1+ PDGFRα- cells). Dashed line demarcates the border between the cortex and corpus callosum. Scale bar 25μm. (b) Representative immunoblot and (c,d) densitometry analysis for CNP, MBP, and actin from cerebrum and cerebellum (unpaired t-test, MBP *p=0.0329, CNP *p=0.0150; n=5 mice per genotype, 2 independent experiments combined; error bars represent +/− SEM). (e) Representative TEM images and (f) calculated g-ratio of optic nerves (6,000x magnification; n=4 mice per genotype, 10 fields per mouse; linear regression analysis with slopes comparison).

