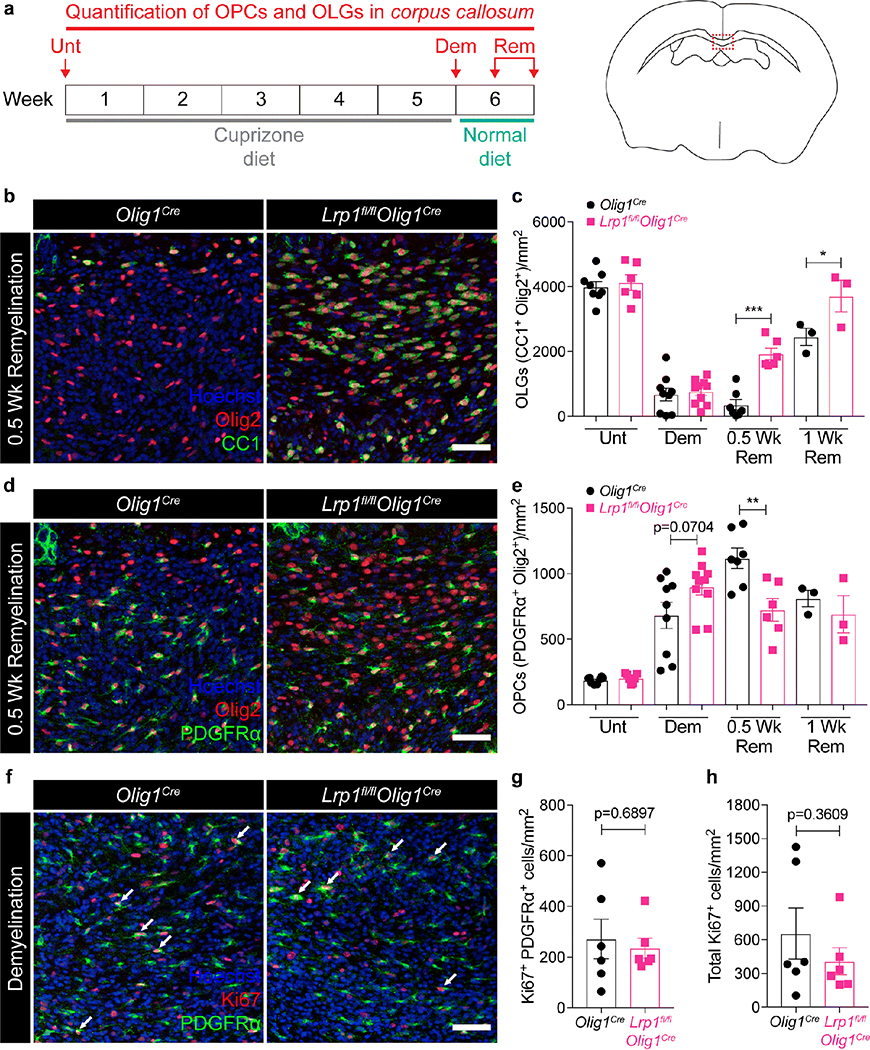
Fig. 3. Mice lacking LRP1 in OPCs display enhanced oligodendrogenesis after cuprizone-induced demyelination.
(a) Schematic illustrating the cuprizone diet timeline and the timepoints at which the corpus callosum was imaged in Olig1cre and Lrp1fl/flOlig1cre mice. (b) Representative images and (c) quantification of oligodendrocytes (CC1+ Olig2+ cells) in the remyelinating corpus callosum (Two-way ANOVA with Sidak’s multiple comparisons test, *p=0.0153, ***p<0.0001; 3 independent experiments combined). (d) Representative images and (e) quantification of OPCs (PDGFRα+ Olig2+ cells) in the remyelinating corpus callosum (Two-way ANOVA with Sidak’s multiple comparisons test, **p=0.0027; 3 independent experiments combined). (f) Ki67 and PDGFRα staining in the corpus callosum at the peak of demyelination (arrows = Ki67+ PDGFRα+ cells). (g) Quantification of Ki67+ PDGFRα+ cells and (h) total Ki67+ cells in the corpus callosum at the peak of demyelination (unpaired t-test; 2 independent experiments combined). Each data point represents an individual mouse. All error bars represent +/− SEM. All scale bars 50μm.

