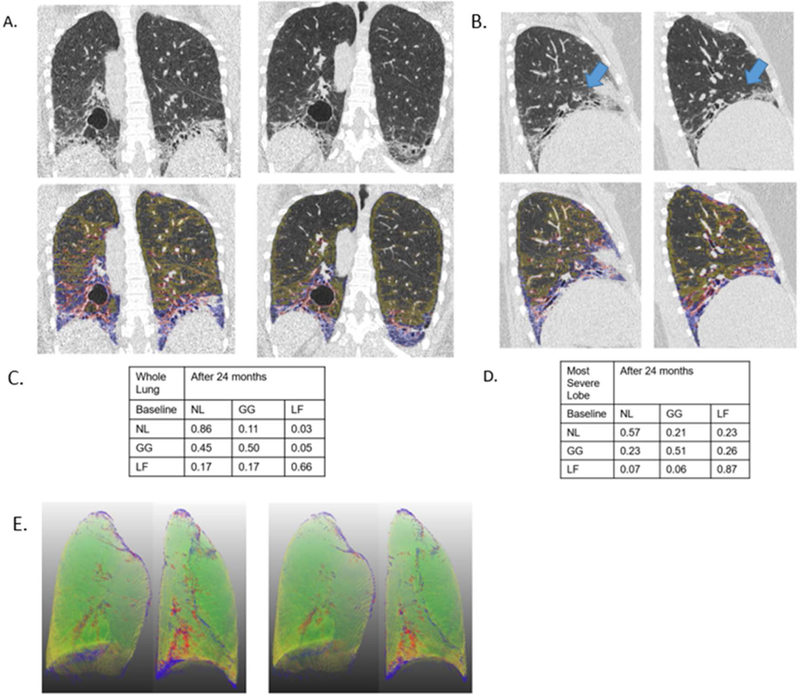
Figure 1.

An example of HRCT images with quantitative lung fibrosis score (blue +red overlay) and ground glass score (yellow overlay) on the baseline and 24 month images is shown for a participant assigned to CYC. The rest of the parenchymal area is quantitative normal lung pattern. The 3 rows and 3 columns of the matrix (in tabular form) are the transitional probabilities in this individual subject for whole lung and the most severe lobe (i.e. in this case, the left lower lobe). A. whole lung coronal images; B. sagittal images (blue arrows for right middle lobe); C. whole lung transitional matrix; and D. Most severe lobe (the right middle lobe for this subject) transitional matrix; E. 3D rendering of coronal images for this participant with normal pattern (green), with quantitative lung fibrosis score (blue +red overlay) and ground glass score (yellow overlay).
