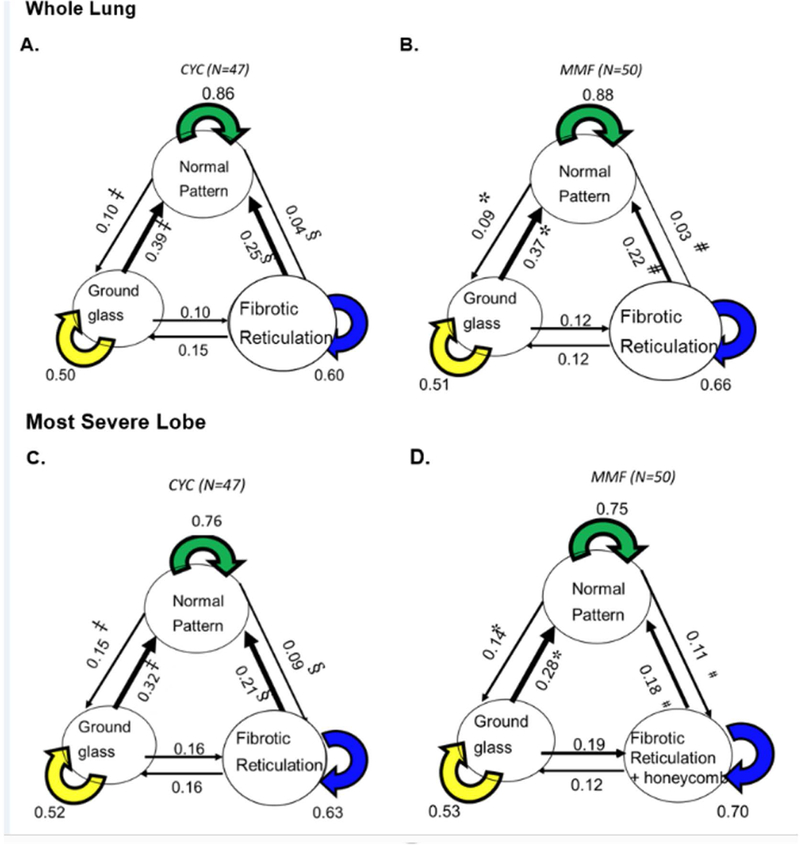
Figure 3.

Schema of transitional matrix by treatment arm: (A) Whole lung in cyclophosphamide (CYC) arm, ‡ p<0.0001, § p<0.0001, and p=0.0568 representing the net improvement between GG and NL patterns, between LF and NL, and between LF and GG, respectively; (B) Whole lung in mycophenolate mofetil (MMF) arm, * p<0.0001, # p<0.0001, and p=0.74 representing the net improvement between GG and NL, between LF and NL, and between LF and GG, respectively; (C) Most severe lobe in CYC arm: ‡ p=0.0008, § p=0.0009, and p=0.87, representing the net improvement between GG and NL, between LF and NL, and between LF and GG, respectively; (D) Most Severe lobe in MMF arm, *p=0.0002, #p=0.017, and p=0.17 representing the net improvement between GG and NL, between LF and NL, and between LF and GG, respectively.
