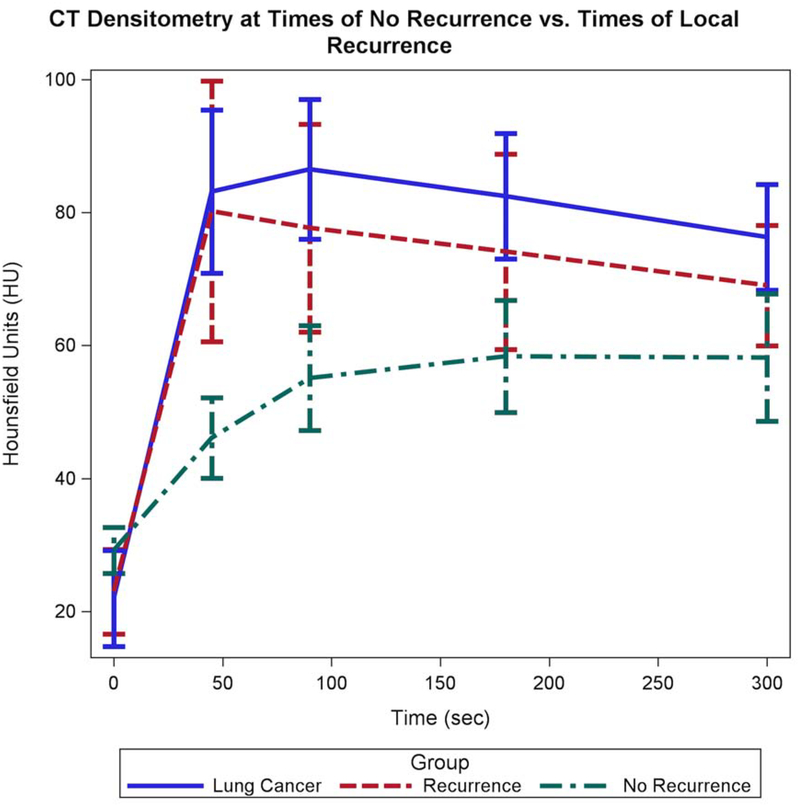
Figure 4:
Graph shows the aggregate data from the CT Densitometry at pretreatment, times of recurrence, and times of no recurrence. There are pronounced similarities between the pretreatment CT Densitometry and times of recurrence. These lines show rapid enhancement at 45 seconds and plateau to slight wash out from 45 seconds to 300 seconds. At times of no recurrence, the ablation zone shows progressive enhancement over time consistent with the enhancement of scar tissue.

