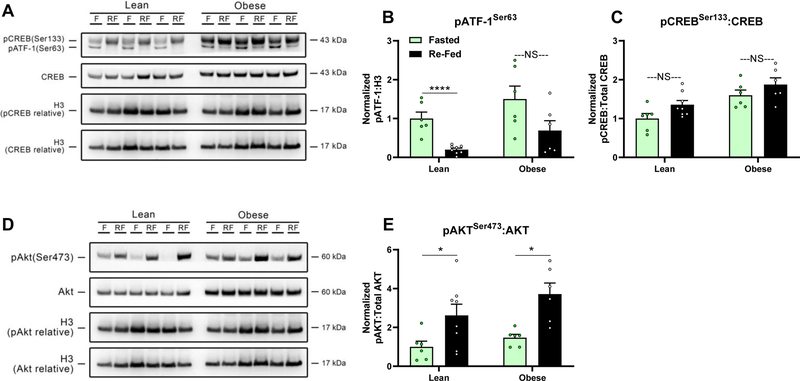
Figure 5.
Phosphorylation levels of A,B,C) Ser133 in CREB, Ser63 in ATF-1, and total CREB protein, as well as D&E) phosphorylated Ser473 in AKT and total AKT protein in livers of lean (fasted: n=6, re-fed: n=8) and diet-induced obese (fasted: n=6, re-fed: n=6) mice fasted for 16h or re-fed for 2h after a 16h fast. A&D) Representative Western blots and B,C&E) densitometric quantification normalized to Histone H3. F (fasted), RF (re-fed); *P<0.05, ****P≤0.0001, NS (not significant). Bars indicate means ± SEM.

