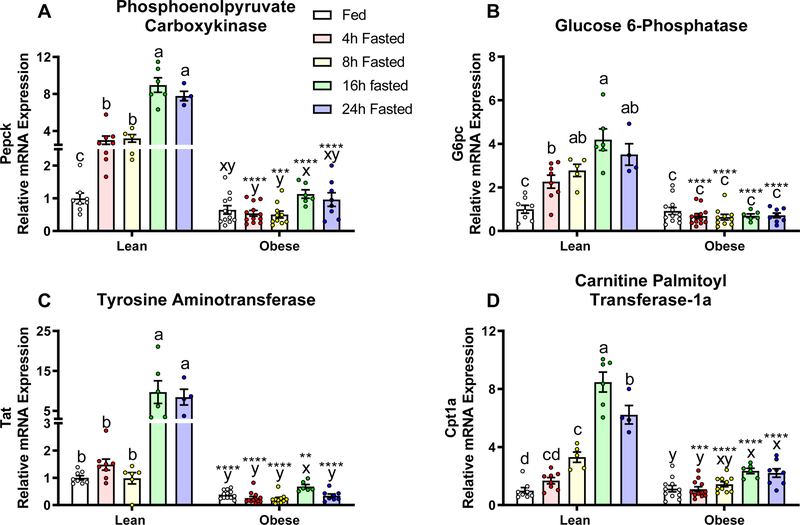
Figure 6.
Relative mRNA expression of glucagon-responsive genes, A) Phosphoenolpyruvate Carboxykinase (PEPCK), B) Glucose 6-Phosphatase, C) Tyrosine Aminotransferase, and D) Carnitine Palmitoyl Transferase-1a (CPT-1a) in lean (fed: n=8, 4h: n=8, 8h: n=5, 16h: n=6, 24h fasted: n=4) and diet-induced obese (fed: n=12, 4h: n=12, 8h: n=10, 16h: n=6, 24h fasted: n=8) mice fed ad libitum, or fasted for 4, 8, 16, or 24 hours. Gene expression was normalized to the housekeeping gene ACTβ and presented as relative expression compare to the lean- fed group. Letters that differ indicate differences within group (a,b,c Lean, x,y,z Obese), P < 0.01; ****, ***,**,* indicates when obese differs from lean within timepoint, ****P≤0.0001, ***P<0.001, **P <0.01, *P<0.05. Bars indicate means ± SEM.

