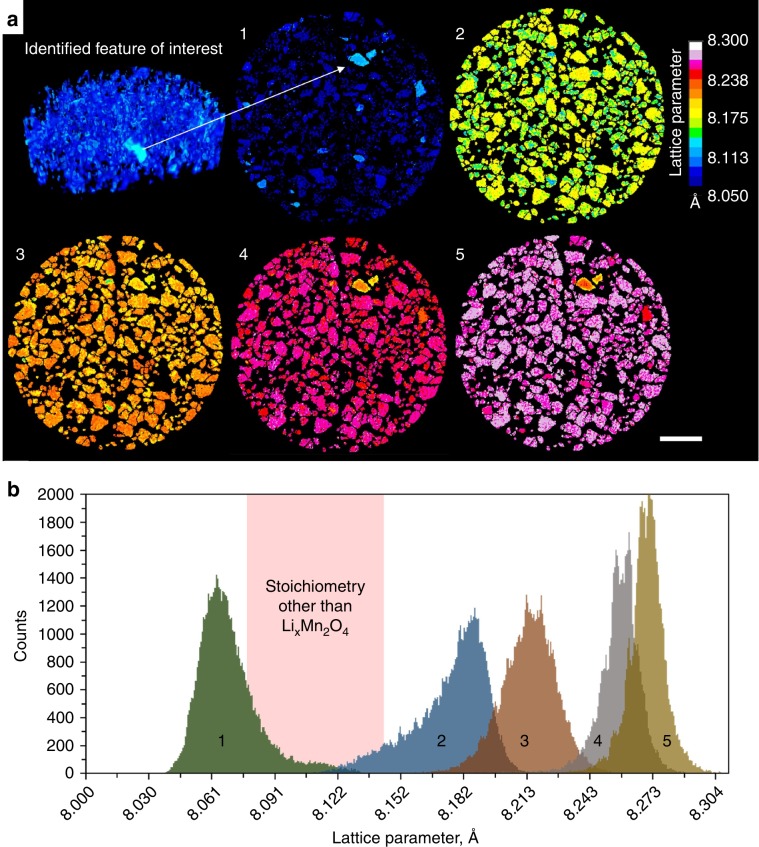
Fig. 2. Lattice parameters from XRD-CT reconstructions of the LixMn2O4 electrode during lithiation.
a (Top left) 2 µm resolution multi-slice XRD computed tomogram used to identify a region of interest. (1–5) Sequential 1 µm resolution XRD-CT slices taken during discharge of the Li vs LMO cell, showing the progression of lithiation of the LMO phase. Scale bar is 50 µm. b Histograms composed of the lattice parameter values assigned to each voxel in XRD-CT slices 1–5. The pink region highlights the range of lattice parameter values over which a bi-phasic reaction of LixMn2O4 passes without occupying, i.e., a region that is not characteristic of the spinel LixMn2O4 stoichiometry.

