Figure 1.
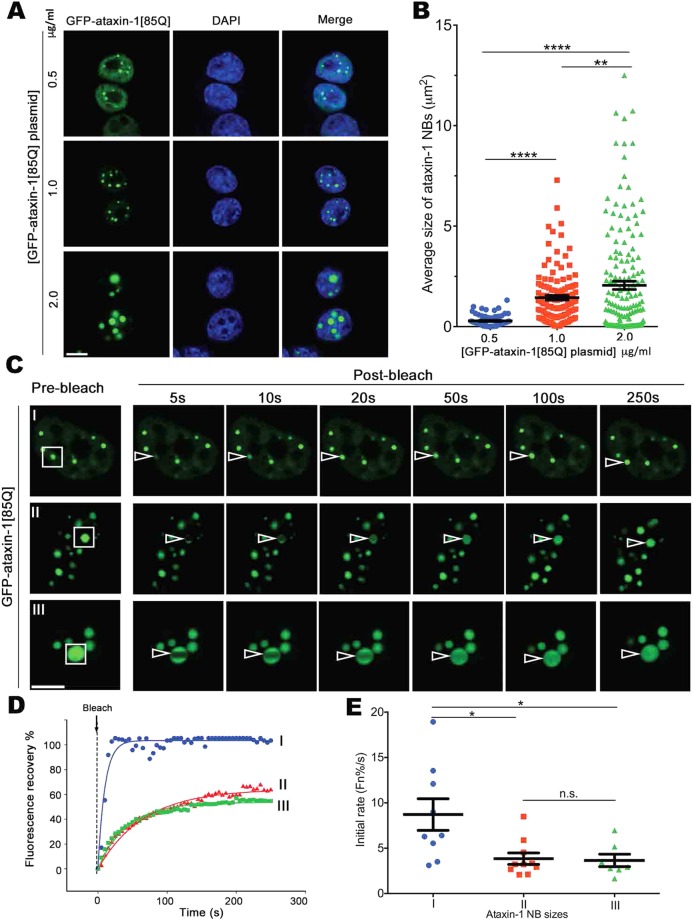
Ataxin-1 forms concentration-dependent nuclear bodies (NBs) that are highly dynamic. Neuro-2a cells were transfected to express GFP-ataxin-1[85Q]. (A) At 24 h post-transfection with different plasmid concentrations (0.5, 1.0, or 2.0 μg/ml), cells were fixed and stained with DAPI before CLSM imaging. Representative images are shown from 3 independent experiments. (B) Average sizes of ataxin-1 NBs corresponding to the conditions as per (A) were measured using CellProfiler. Results represent the mean ± SEM (n > 70). Significance values calculated by ANOVA, **p < 0.01, ****p < 0.0001. (C–E) At 24 h post-transfection, cells were incubated in an imaging chamber equilibrated with 5% CO2 at 37 °C prior to FRAP using CLSM. (C) Representative images are shown from 3 independent experiments with FRAP assessments of exchange dynamics of GFP-ataxin-1[85Q] for different size NBs (denoted as I with diameter ≤0.75 μm, II with diameter 0.75–2 μm, and III diameter >2 μm). White rectangles indicate the ataxin-1 NBs analyzed; white open arrowhead indicates photobleached area. All scale bars = 10 μm. (D) Plot of the percentage recovery of fluorescence from experiments as shown in (C I-III) Each symbol represents fluorescence measured at the indicated time for the indicated ROI. (E) Recovery initial rates (average percentage recovery of fluorescence in the first 15 s) (Fn%/s) were calculated and shown by the pooled data. Each symbol represents a single data point obtained from one ROI across 3 independent experiments. Results represent mean ± SEM (n > 7 measured ROIs). Significance values were calculated by ANOVA, *p < 0.05.

