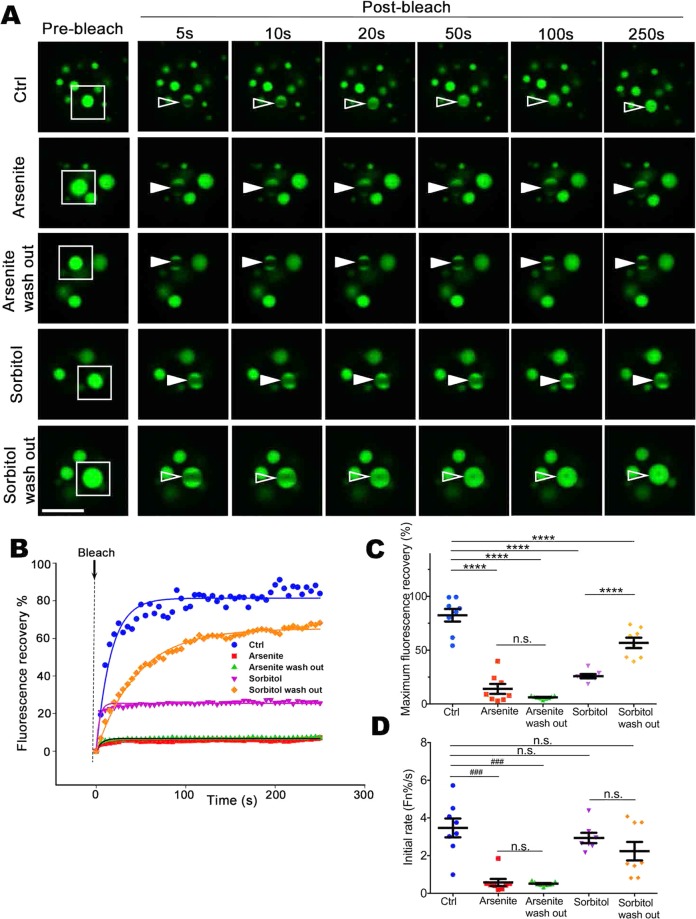
Figure 4.
Different stresses can inhibit ataxin-1 NB exchange dynamics either irreversibly or reversibly. Neuro-2a cells were transfected to express GFP-ataxin-1[85Q]. At 24 h post-transfection, cells were left untreated (Ctrl) or treated with arsenite (0.3 mM, 1 h) (Arsenite) or sorbitol (0.5 M, 1 h) (Sorbitol). Following wash out (three washes with PBS), cells were left to recover from the stress treatment for 3 h (Arsenite wash out or Sorbitol wash out). (A) Representative images are shown from 3 independent experiments for quantitative assessments of GFP-ataxin-1[85Q] exchange dynamics. White rectangle indicates ataxin-1 NB imaged analyzed. A small ROI (indicated by white open arrowhead for dynamic NB or white solid arrowhead for non-dynamic NB) was photobleached and the fluorescence recovery was subsequently monitored as post-bleach at 5 s intervals for 250 s. (B) Plot of the percentage recovery of fluorescence from experiments as shown in (A). Each symbol represents fluorescence measured at the indicated time. (C,D) Results for pooled data for FRAP experiments. The recovery of fluorescence for GFP-ataxin-1[85Q] over time was analyzed. Each symbol represents a single data point. Results represent the mean ± SEM for (C) fluorescence maximum recovery percentage in the bleached area (where 100% represents full recovery) and (D) the initial rate of fluorescence recovery percentage in the bleached area for first three time points (0–15 s of post-bleach). Significance values were calculated by (C) ANOVA or (D) Mann-Whitney and Kruskal-Wallis non-parametric test, n > 7, ****p < 0.0001, ###p < 0.001, n.s. = not significant. All scale bars = 10 μm.

