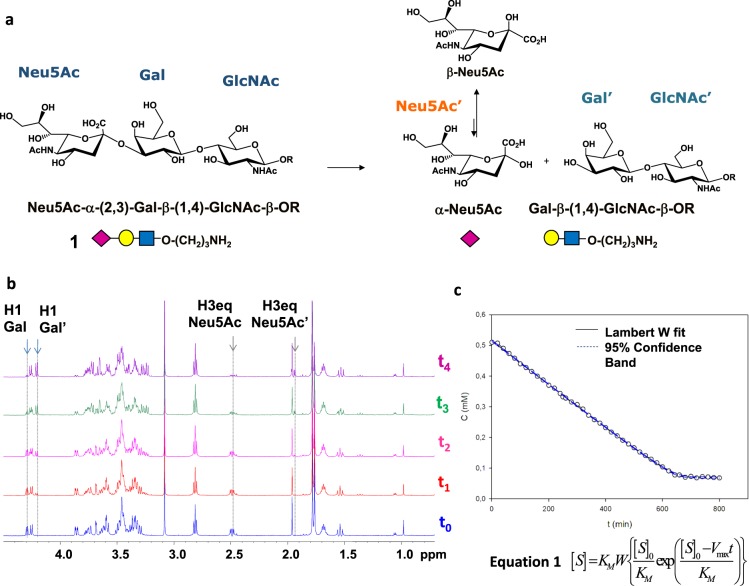
Figure 1.
(a) Scheme of the mechanism of hydrolysis of substrate 1 catalyzed by MuV-HN neuraminidase. The 3D Symbol Nomenclature For Glycans (SNFG) has been used. Chem Draw 2006 Software (http://www.cambridgesoft.com) was used to draw the sugar moieties. (b) Section of 1H-NMR spectra at different time of the enzymatic reaction have been reported. 7.5 μM of MuV-HN and 550 μM of 1 were solved in PBS deuterate buffer (pH = 7). The NMR quantification of the substrate concentration was performed by integration of the well-dispersed resonances of 1 (H1 Gal, H3eq Neu5Ac). The NMR spectra were plotted by using the xwinplot tool of TopSpin 3.6.1 software (www.bruker.com). (c) Analysis of the MuV-HN kinetics toward substrate 1 by means of the explicit reformulation of the integrated form of MM equation with Lambert W fit as solution. The plot of the concentration of 1 as function of time has been reported. The substrate concentration was evaluated from the H3eq resonance of Sia unit. The fit of the kinetic data by the Lambert-W fit afforded a KM value of 12 μM and Vmax of 7 * 10−3 (mM/min). The blue dashed line represented the confidence interval of the fit. Data were analyzed by Sigma Plot 11.0 (http://www.sigmaplot.co.uk/).

