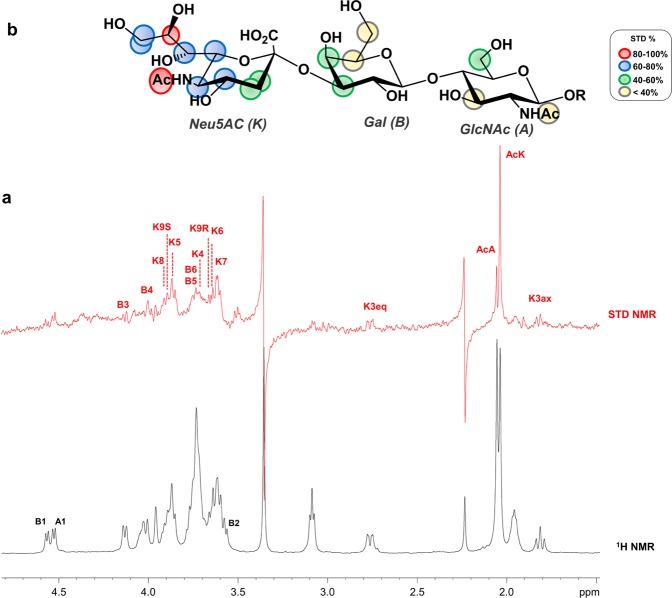
Figure 2.
STD NMR analysis of trisaccharide 1 in the interaction with MuV-HN. (a) The off-resonance spectrum as reference (black) and the STD (red) of MuV-HN–trisaccharide-1 mixture with a molecular ratio of 1:70, at 283 K. (b) Epitope map of 1. STD percentages were calculated by (I0 – Isat)/I0 ratio, normalized with respect to the highest STD signal of the acetyl group belonging to sialic acid. Chem Draw 2006 Software (http://www.cambridgesoft.com) was used to draw the substrate. The NMR spectra were plotted by using the xwinplot tool of TopSpin 3.6.1 software (www.bruker.com).

