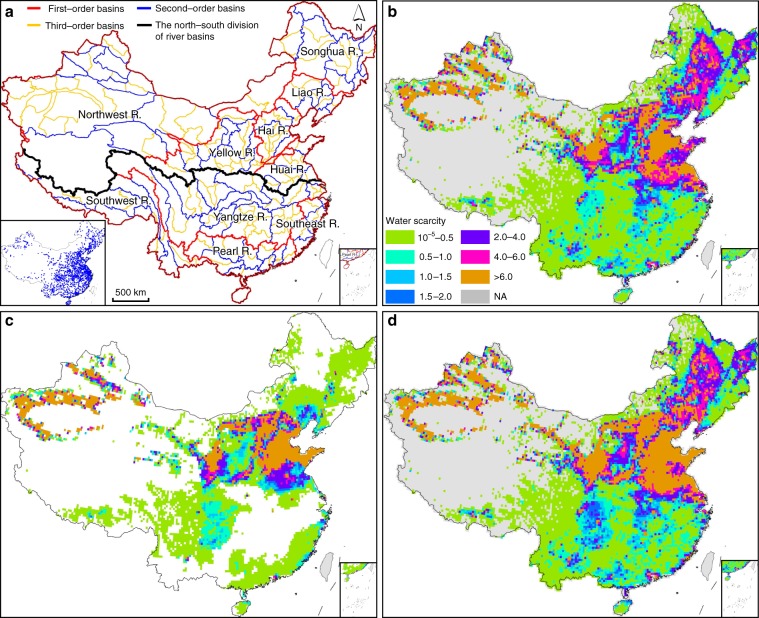
Fig. 1. Estimates of annual water scarcity at the grid cell level in China.
a Spatial distributions of river basins in this study. b Quantity-based water scarcity (WSqua). c Pollution-induced water scarcity (WSpol). d Combined water scarcity, including both quality and quantity effects (WScom). Estimated water scarcity was based on the average of annual assessments during 2012–2016 at a spatial resolution of 0.25 × 0.25 arc-degree (n = 15997). The graph at the lower left corner in a represents the sampling locations of water quality. Maps of grid cell-level WScom at other time scales are shown in Supplementary Fig. 2. NA, no data or water scarcity is <10−5. Source data are provided as a Source Data file.

