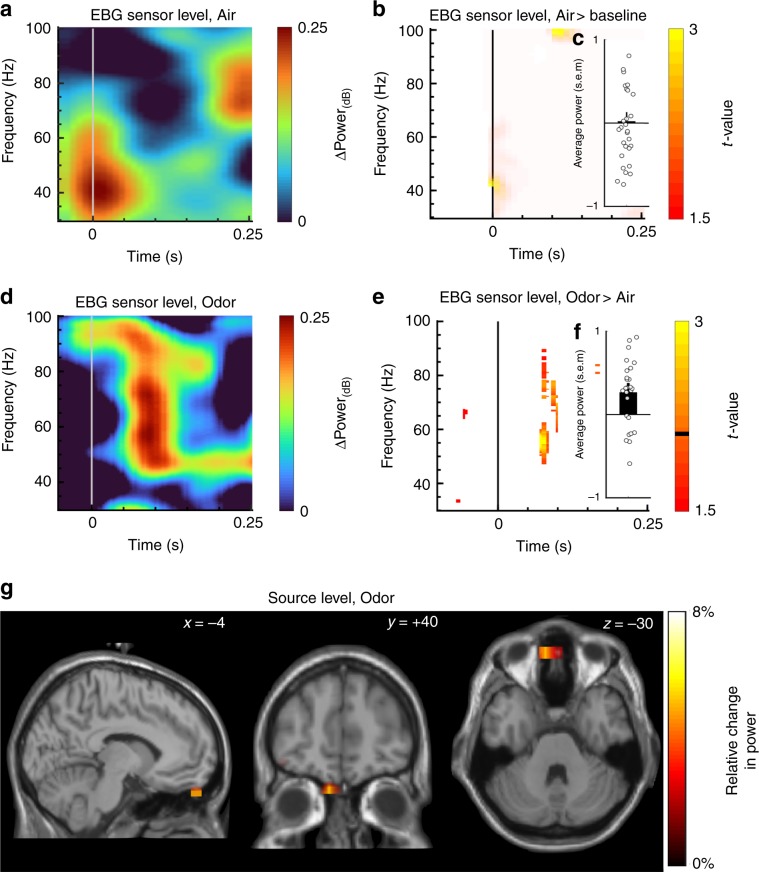
Fig. 2. Localization of odor-evoked response in sensor and source space (n = 29).
a Sensor time-frequency decomposition of difference in power for Air vs. Baseline condition for the EBG electrodes. b T-statistics derived from 1000 Monte Carlo permutations demonstrating no change in power for inhalation of Air only condition for the EBG electrodes. c Averaged power change for Air across 100–125 ms with standard error of the mean (s.e.m). Circles show individual values. d Sensor time-frequency decomposition for Odor against Air conditions. e T-statistics derived from 1000 Monte Carlo permutations contrasting Odor with Air conditions (p < .01). Orange color marks significant change in power for Odor against Air and the black horizontal line on the color-bar marks the threshold for displayed t-values. f Averaged power change for Odor condition across 100–125 ms with s.e.m. Circles show individual values. g Reconstructed sources of the olfactory evoked synchronization indicating olfactory bulb as the source. Color bars denote relative change in power and x, y, z coordinates in figures indicate coordinates of slice in Talairach space according to the MNI stereotactile reference system.

