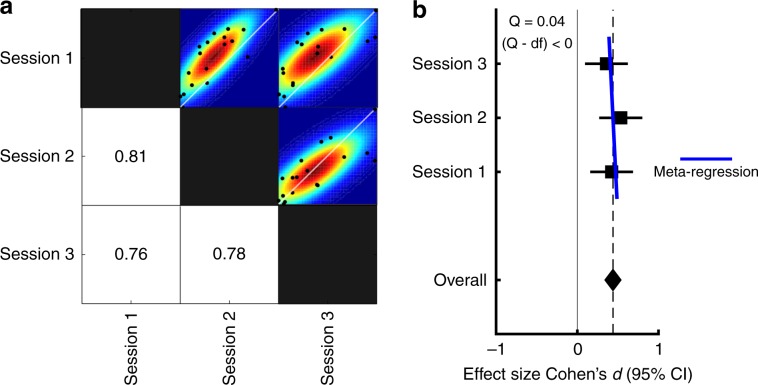
Fig. 3. Test–retest reliability and dispersion rate of the EBG (n = 18).
a Pairwise correlation matrix across the three sessions. Values indicate bivariate Pearson correlation coefficients and black dots within scatter plots shows individual values for each comparison. Colors indicate mean dispersion with colors indicating smoothed underlying distribution based on bootstrapping of the test data. b Effect size and 95% confidence interval for EBG detection within each testing session (CIsession1 = [0.16, 0.68], CIsession2 = [0.27, 0.80] and CIsession3 = [0.10, 0.62]). Overall effect showed medium effect size (Cohen’s d = 0.44) and meta-regression showed insignificant dispersion among the three sessions.

