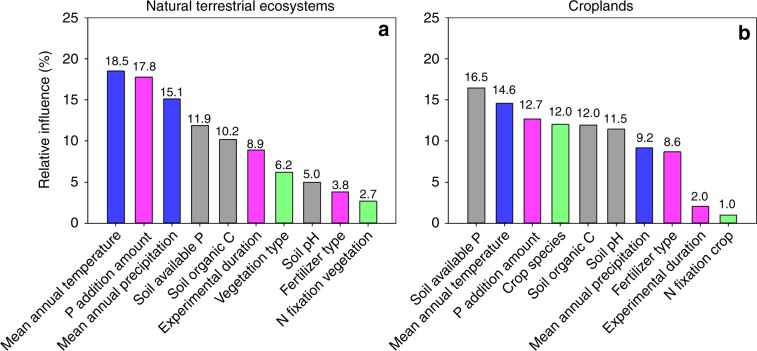
Fig. 4. Relative influence of climate, fertilization regimes, and ecosystem properties on the magnitude of P limitation.
a Natural terrestrial ecosystems. b Croplands. The number above each bar indicates the percentage of the total explained variation accounted for by the variable. Fertilization regimes are in pink, climate factors are in blue, soil properties are in gray, and vegetation properties are in green. Source data are provided as a Source Data file.

