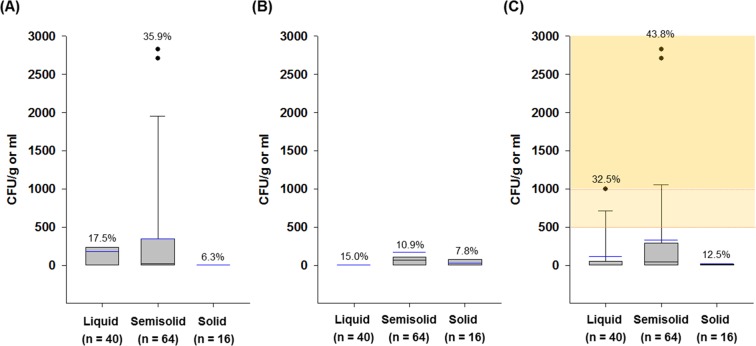
Figure 2.
Box plots of (A) total bacterial counts, (B) total mold and yeast counts, and (C) total aerobic microbe counts of different formulations of customized cosmetics (n = 120): liquid (n = 40), semisolid (n = 64), and solid (n = 16). Square means of the interquartile range for each data point, and the black and blue lines indicate the median and mean values, respectively. The error bars above and below the square denote the 90th and 10th percentiles, and the black circles represent outliers. Values (%) on the bars indicate the detection rate of each microorganism in the samples, and ND indicates no detection of microorganisms.

