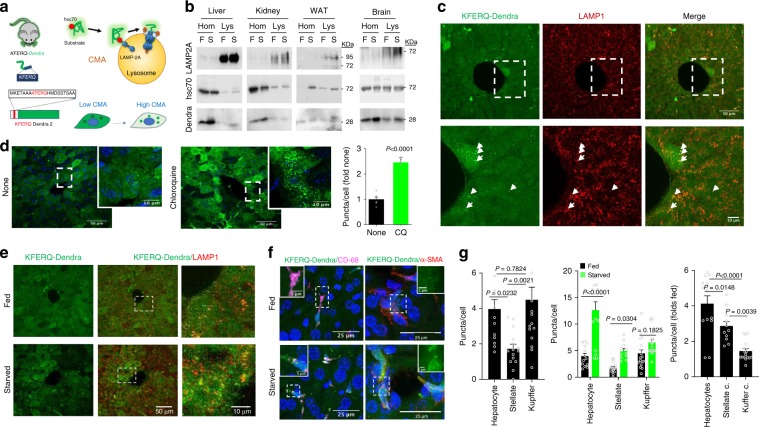
Fig. 1. KFERQ-Dendra expression, lysosomal association and degradation in KFERQ-Dendra mice.
a CMA-targeting motif in Dendra to generate the KFERQ-Dendra mouse lines. Right: CMA steps. b Representative immunoblot for Dendra in homogenates (Hom) and lysosomes (Lys) from the indicated tissues of fed (F) or 24 h starved (S) KFERQ-Dendra mice. All samples per experiment were run in the same membrane but for each protein different membranes were used. Similar results were obtained in three independent experiments. c Green fluorescence (from KFERQ-Dendra) and immunofluorescence (for LAMP1) of livers from 24 h starved KFERQ-Dendra mice. Bottom: Higher magnification of the dotted square. Arrows: examples of LAMP1-positive compartments with KFERQ-Dendra. Similar results were obtained in four independent experiments. d Immunofluorescence for Dendra (pseudocolor in green) in liver sections from KFERQ-Dendra mice 12 h after injection with PBS (None) or chloroquine. Blue: DAPI staining. Right: Average number of fluorescent puncta in chloroquine-injected relative to PBS-injected livers. n = 6 (PBS) and 7 (CQ) sections (total 740 cells) coming from three independent experiments. e, f Immunostaining for LAMP1 (e) or for CD68 or α-SMA (f) to label Kupffer and hepatic stellate cells, respectively, in fed or 24 h starved KFERQ-Dendra mice livers. Insets: green channel at higher magnification. g Quantification of Dendra positive puncta in hepatocytes, Kupffer and stellate cells in fed mice livers (left), comparison in fed and starved mice livers (middle) and fold changes in Dendra-positive puncta with starvation (right). n = 13 (fed hepatocytes), 15 (starved hepatocytes), 17 (fed and starved Kupffer cells), 15 (fed stellate cells), and 12 (starved stellate cells) sections coming from three independent experiments. Data are presented as mean values ± s.e.m. Two-tailed unpaired t test (d), One-way ANOVA followed by Tukey’s multiple comparisons tests (g left and right) and Two-way ANOVA test followed by Sidak’s multiple comparisons tests (g middle) were used. Test statistic (F, t, R) and freedom degree for (d) and (g) and source data are provided in the Source Data file.

