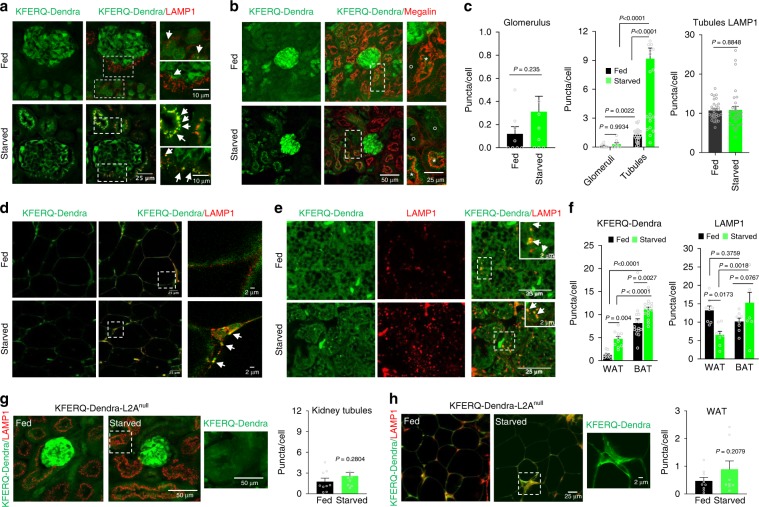
Fig. 2. Tissue-specific changes in CMA in response to starvation.
CMA (measured as number of fluorescent puncta per cell) in sections from kidney (a–c) and white and brown adipose tissue (d–f) of fed or 24 h starved KFERQ-Dendra mice. a, b Green KFERQ-Dendra fluorescence in kidney immunostained for LAMP1 (d) or Megalin (e) to stain proximal tubules. Megalin positive (star) and negative (circle) tubules and LAMP1 puncta positive for Green Dendra fluorescence (arrows) are shown. c Changes in Dendra-positive puncta in glomerulus (left) or glomerulus compared with tubules (middle) and in LAMP1 staining in tubules (right). Dendra values are from n = 8 (fed glomeruli), 9 (starved glomeruli), 27 (fed tubules) and 29 (starved tubules) sections coming from three independent experiments and LAMP1 values are from n = 32 (fed tubules) and 31 (starved tubules) sections from the same experiments. d, e Green KFERQ-Dendra fluorescence in white (WAT, d) and brown (BAT, e) adipose tissue immunostained with LAMP1. Arrows: LAMP1 and Green Dendra fluorescence positive puncta. f Dendra-positive puncta (left) and LAMP1 puncta (right) in WAT and BAT in fed and starved mice. Dendra values are from 10 (fed WAT), 11 (starved WAT), 15 (fed BAT) and 10 (starved BAT) sections coming from three independent experiments and LAMP1 values from 8 sections from all conditions from the same experiments. g, h KFERQ-Dendra fluorescence in kidney (g) and WAT (h) from fed or starved for 24 h KEFRQ-Dendra and KFERQ-Dendra-L2Anull mice immunostained with LAMP1. Inset: green channel of boxed area. Right: Dendra-positive puncta quantification from 9 sections of each organ and condition coming from four independent experiments. Insets show boxed areas at higher magnification. Data are presented as mean values ± s.e.m. Two-tailed unpaired t-tests (c right and left, g, h) and two-way ANOVA test followed by Sidak’s multiple comparisons tests (Fig. 2c middle and f) were used. Source data are provided in the Source Data file.

