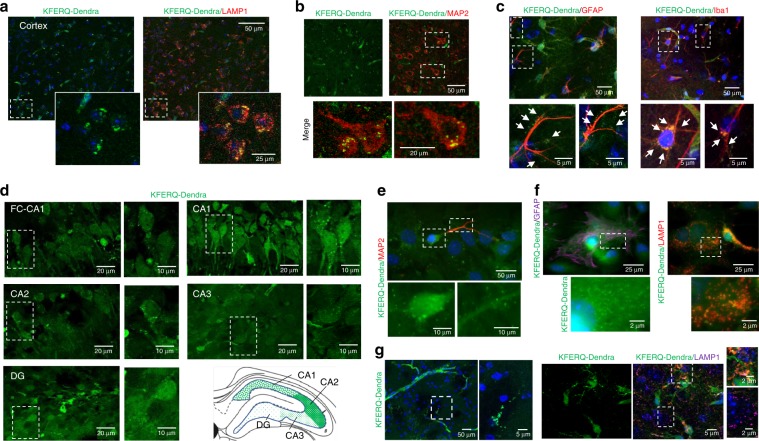
Fig. 3. CMA activity in brain.
a Green fluorescence (for KFERQ-Dendra) and immunofluorescence (for LAMP1) of cerebral cortex from KFERQ-Dendra mice. Insets: boxed area at higher magnification. Nuclei are highlighted in blue. b, c Green KFERQ-Dendra fluorescence in the same regions immunostained with MAP2 (to label neurons) (b), GFAP (to label astrocytes) or IBA1 (to label microglia). Arrows: green fluorescent puncta. Boxed areas are shown at higher magnification at the bottom (c). d Green KFERQ-Dendra fluorescence in the indicated regions of the hippocampus of KFERQ-Dendra mice. Boxed areas are shown at higher magnification on the right. The cartoon depicts the areas analyzed and abundance of the fluorescent puncta in each region. e Direct KFERQ-Dendra fluorescence in primary neuronal cultures prepared from KFERQ-Dendra mice brains. Insets show the boxed regions of soma and neurites at higher magnification for the green channel only to better appreciate presence of fluorescent puncta. f Green fluorescence (for KFERQ-Dendra) and immunofluorescence (for GFAP or LAMP1) in primary astrocyte cultures prepared from KFERQ-Dendra mice brains. Boxed areas are shown at higher magnification at the bottom. g Green fluorescence (for KFERQ-Dendra) and immunofluorescence (for LAMP1) in brain sections from KFERQ-Dendra mice 4 days after culture. Merged images are shown on the right, where nuclei are highlighted with DAPI. Boxed areas are shown at higher magnification on the right. Experiments were repeated 3 times (for a, b, d) and 5 times (for c, e, f, g) with similar results.

