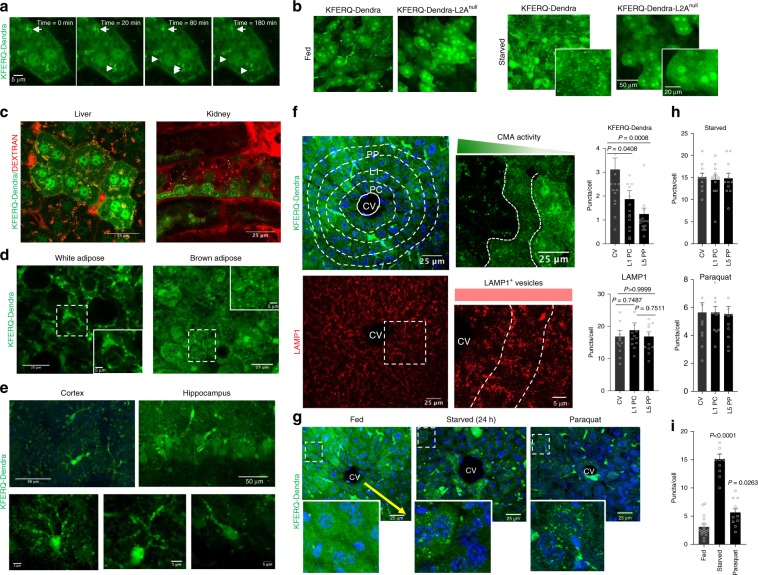
Fig. 4. Spatial and temporal analysis of CMA.
a Still images from an intravital imaging time-lapse movie of liver from KFERQ-Dendra mice showing the dynamics of several CMA lysosomes (arrows). Similar results were obtained in four independent experiments. b Representative two-photon microscopy images of livers from fed or 24 h starved KEFRQ-Dendra and KFERQ-Dendra-L2Anull mice. Insets: higher magnification. Similar results were obtained in three independent experiments. c, d Representative images of liver and kidney (c) and WAT and BAT (d) from 24 h starved KFERQ-Dendra mice. In c mice were injected with 155 KDa TRITC Dextran (red) to highlight lysosomal compartments. Similar results were obtained in four independent experiments, Insets: Boxed area at higher magnification. e Top: Maximum projection of cortical (left) and hippocampus (right) regions from KFERQ-Dendra mice imaged with two-photon microscopy. Bottom: examples of magnified individual cells. Similar results were obtained in four independent experiments. f Left top: KFERQ-Dendra mice liver section with delineated sub-zoning. CV: central vein, L1 PC: layer 1 pericentral, L5 PP: layer 5 periportal. DAPI is shown in blue. Right: Higher magnification liver region. Bottom: LAMP1 staining of full field (left) and higher magnification region with delineated zones (right) of liver. Right: Number of KFERQ-Dendra (top) and LAMP1 (bottom) positive puncta in liver regions. Values are from 16 (Dendra) and 12 (LAMP1) sections coming from 4 independent experiments. g Image of livers from KFERQ-Dendra mice fed, starved for 24 h or paraquat (PQ) injected. Insets: higher magnification of regions distal from the CV. Yellow arrow: KFERQ-Dendra positive puncta gradation. h Fluorescent puncta per cell in regions of starved or PQ-treated KFERQ-Dendra mice livers. i Overall number of fluorescent puncta in the same livers as (g). Values in h and i are from 11 (CV), 12 (L1PC) and 12 (L5PP) sections (panel h), and 16 (fed), 11 (starved) and 11 (PQ) sections (panel i) Data are presented as mean values ± s.e.m. One-way ANOVA test followed by Dunnett’s multiple comparisons test was used. Source data are provided in the Source Data file.

