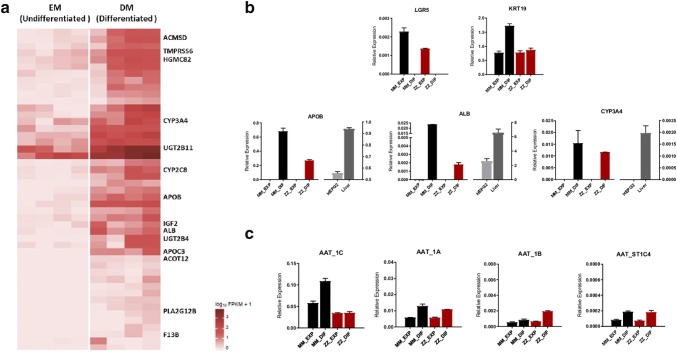
Fig. 2.
Gene expression analysis in human liver organoids. a Heatmap of the top up-regulated differentially expressed genes between undifferentiated organoids (EM) and organoids differentiated into hepatocytes (DM). Some of the most relevant mature hepatocyte genes are represented at the right side. Darker color means higher expression levels. Gene expression analysis of differentiation markers in organoids MM (black) and ZZ (red) under expansion and differentiation conditions: b expression of markers of pluripotent (LGR5), ductal cells (KRT19) and differentiated hepatocytes (ALB, APOB and CYP3A4); c expression of alternative transcripts of SERPINA1 gene (1C, 1A and 1B) and short transcripts (ST1C4) in MM and ZZ organoids

