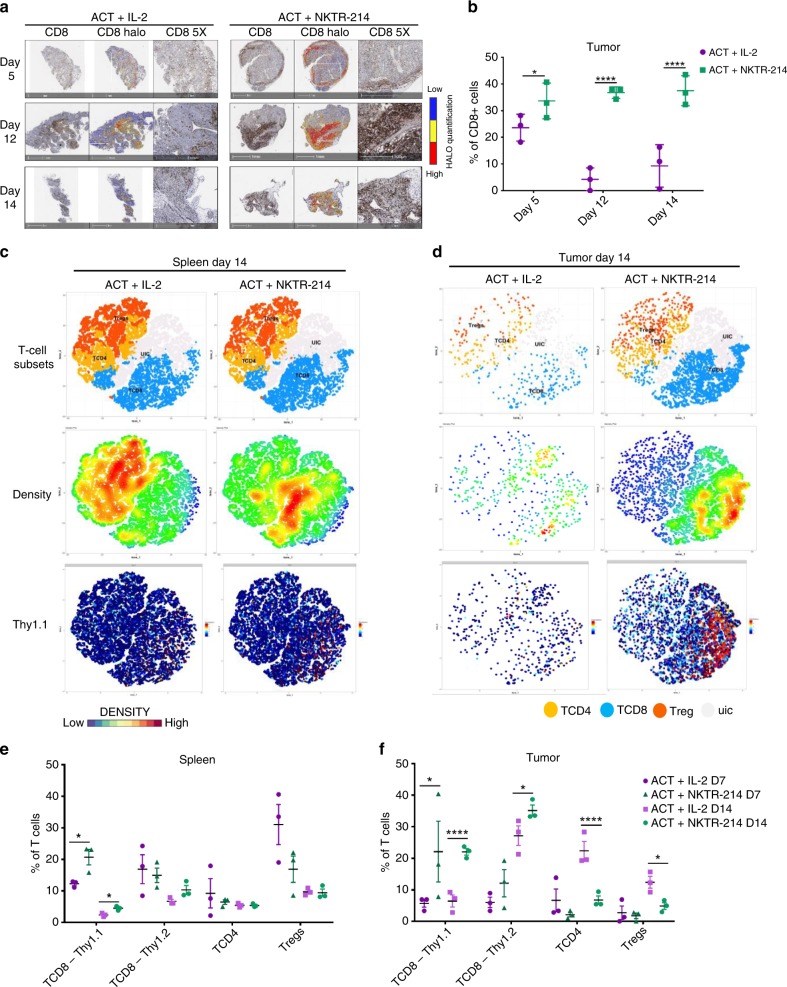
Fig. 4.
Increased T cell infiltration is a significant component of NKTR-214′s anti-tumor efficacy. a Immunohistochemistry (IHC) CD8 T cells staining in tumors at different time points, representative image of three replicates per group. HALO software analysis showing intensity of marker expression, from low expression (blue) to high expression (red). b HALO software digital quantification of IHC slides showing the percentage of CD8 T cells infiltrating the tumor at different time points. *p < 0.05, ****p < 0.0001, mean ± s.e.m, unpaired t-test. c, d Mass cytometry results on T cells compartment. T-SNE plots showing annotated clusters (upper panels), density plots (middle panels) and Thy1.1 marker expression level plot (lower panels) in spleen (c) and tumor at day 14 (d). Density scale bar represents marker expression of cells for a given cluster, ranging from low expression (blue) to high expression (red). In the T cell subsets panels, yellow dots represent CD4+ T cells (TCD4), blue dot: CD8+ T cells (TCD8), orange dots regulatory T cells (Treg), light grey dots: unidentified cluster (uic). e, f Cell frequencies at day 7 and 14 after treatment were calculated for the annotated T cell clusters and displayed on a per-mouse basis in spleen (e) and tumor (f). Mean ± s.e.m (n = 3), *p < 0.05, ****p < 0.0001, unpaired t-test. The experiment is representative of two replicates.

