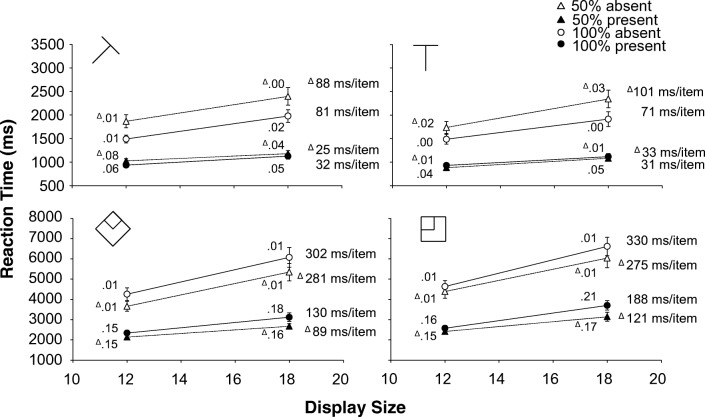
Fig. 3.
Experiment 2. Reaction times as a function of display size. Top half medium search; bottom half difficult search (please note the difference in scale; difficult search is much slower than medium search). Left half: targets created with the diagonal line set. Right half: targets created with the cardinal line set. Dotted lines and triangles: 50% eligibility; solid lines and circles: 100% eligibility. The white symbols are absent trials, the black symbols are present trials. Next to each data point, the proportion error is given. On the side of each graph is the search slope. The error bars represent standard error of the mean. Where there appear to be no error bars, they are covered by the data point

