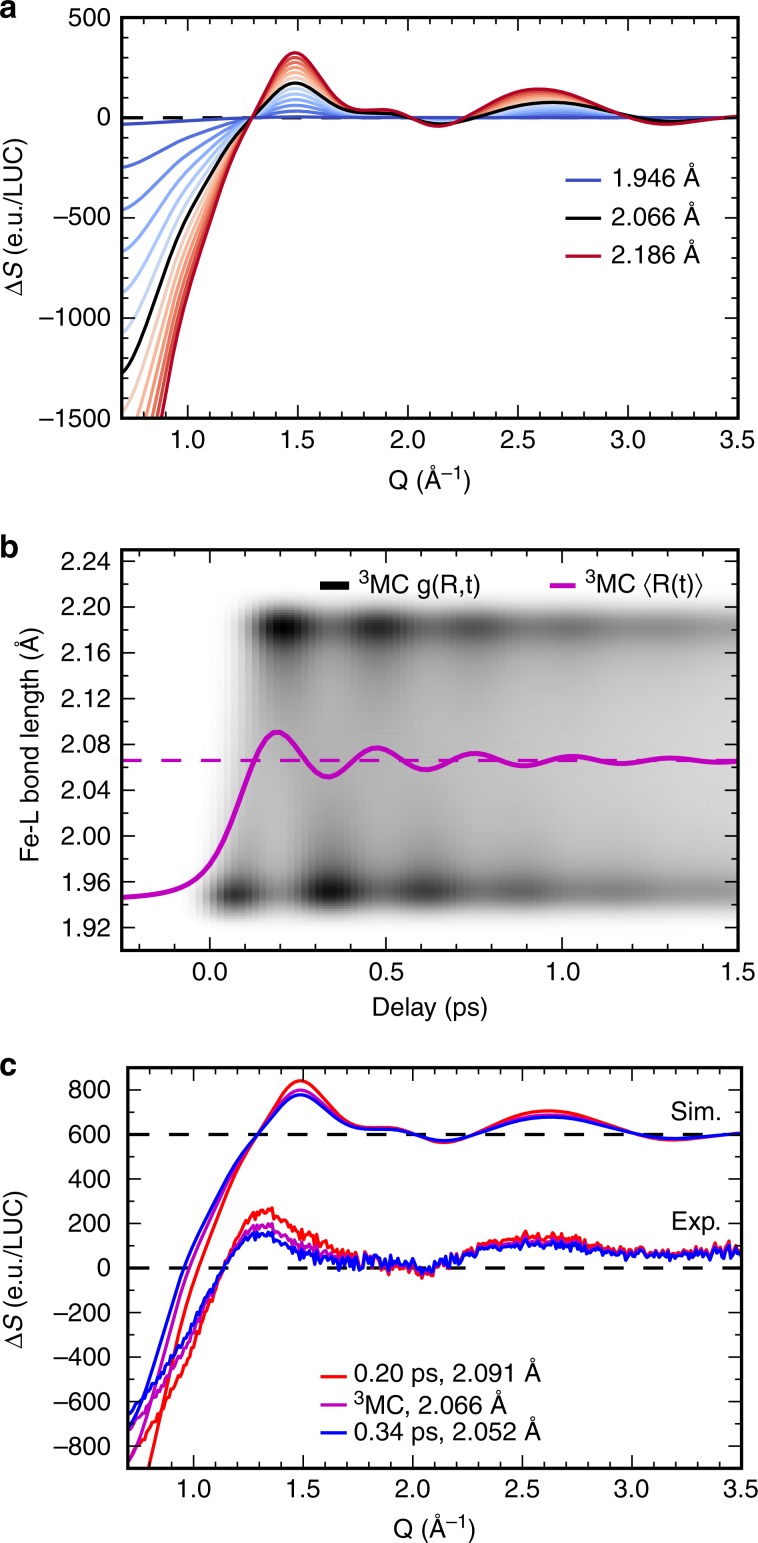
Fig. 5. Simulated solute difference XSS signals.
a Dependence of [Fe(bmip)2]2+ 3MC difference XSS signal from the average Fe-ligand (L) bond length (including solute-solvent scattering). Black line: optimal 3MC structure. Blue lines: shorter bond lengths; red lines: longer bond lengths. Respective bond lengths of the curves are from R = 1.946 Å to R = 2.186 Å, step size is 0.02 Å. b Simulated 3MC bond lengths distribution g(R,t) as a function of time (white-black color scale) and the corresponding ensemble average Fe-ligand bond length (magenta solid line). Magenta dashed line: optimal (equilibrium) 3MC bond length. c Simulation of the time-dependent 3MC difference signal and comparison to the experimental 3MC signal extracted from the global fit (including the oscillatory component). Red line: maximum 3MC structural expansion at 0.20 ps (<R> = 2.091 Å) Magenta line: optimal 3MC geometry (<R> = 2.066 Å). Blue line: maximum 3MC structural contraction at 0.34 ps (<R> = 2.052 Å).

