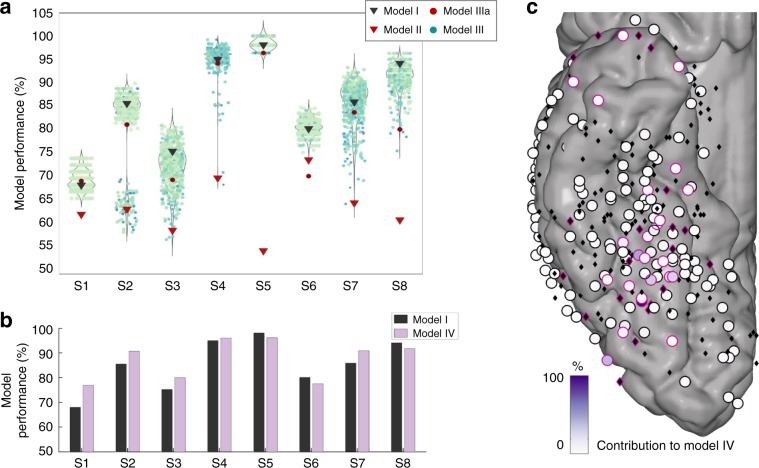
Fig. 2. Nature and amount of face information on TC sites in decoding settings.
a Dark grey triangles represent the performance of model I, i.e., including all TC sites. Performance of model II is represented by red triangles. Red circles represent the performance of model IIIa. Each colored dot represents one of the “random set” models (499 models per subject, model III), their color representing the proportion of face sites were included in the model (dark blue is one face site, light green is all face sites). Violin plots represent the distribution of the “random set” model performances compared to models I and II. b Sparse models perform as well as or better than distributed models. Bar plot representing the balanced accuracy for model I compared to the model accuracy of the sparse model IV, for each subject. c Site contributions to the sparse model, plotted across subjects. The contribution of the site (in %) is represented by a color-coded fill. Black diamonds have a perfectly null contribution to the model while circles had a positive contribution to the model. Sites assessed as human face selective by the univariate analysis are highlighted by a pink rim.

