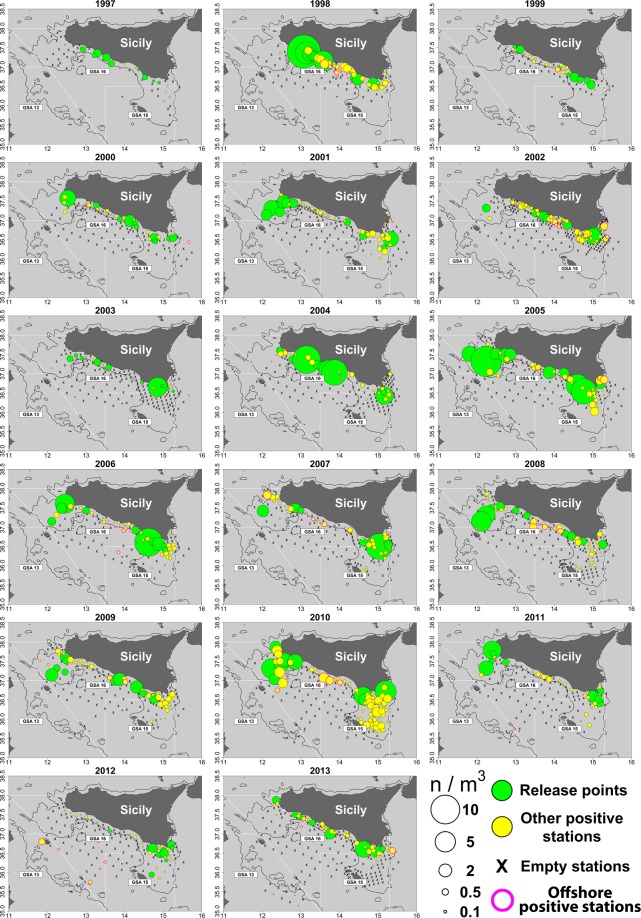
Figure 1.
Anchovy egg distributions in the summer surveys carried out in the study area from 1997 to 2013. Circle sizes are proportional to egg concentration. In green the locations of the top 10 stations over the continental shelf areas in terms of anchovy eggs densities, by year, used as releasing points in the Lagrangian simulation runs; in yellow the other positive stations for the presence of anchovy eggs in the samples. Sampling stations are indicated using “x” symbol. Continental shelf bathymetry (200 m depth) is also depicted with a continuous black line.

