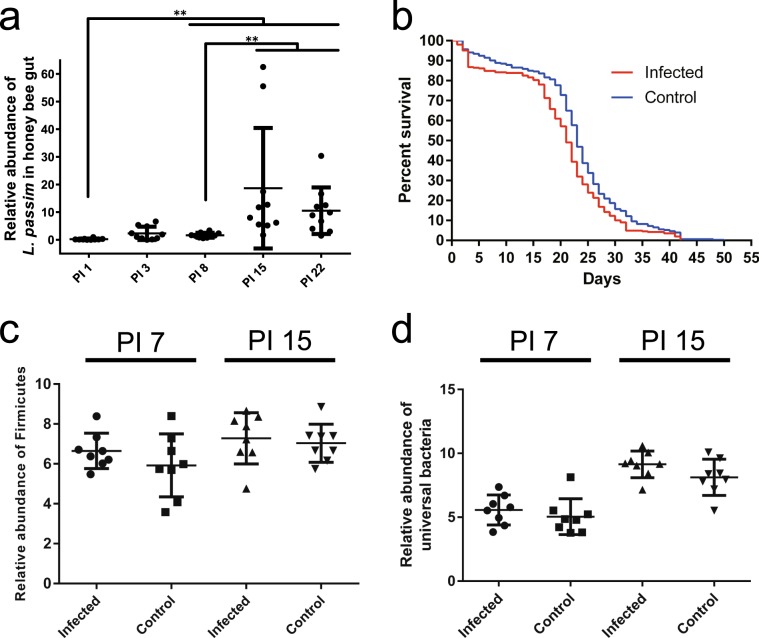
Fig. 1. The effects of L. passim infection on honey bee survival and gut microbiota.
a The abundance of L. passim in individual honey bees (n = 10) at 1, 3, 8, 15, and 22 days after the infection (PI 1–22). In order to compare the relative abundance of L. passim, one honey bee sample on day 1 was set as 1 and thus nine samples were statistically analyzed for day 1. Steel-Dwass method was used for the statistical analysis between the different time points. Mean values ± SD (error bars) are shown. **P < 0.01. b Survival of honey bees infected by L. passim at 33 °C under laboratory condition. Newly emerged honey bees (n = 96–110) were either infected by 105L. passim (Infected, red) or fed with sucrose solution (Control, blue) at day 0, and then the survival rates were recorded every day. The experiment was repeated three times and the average values are shown. The data were statistically analyzed by Log-rank (Mantel–Cox) test (P = 0.0002). Relative abundance of Firmicutes (c) and universal bacteria (d) in L. passim-infected (Infected) and the uninfected (Control) honey bees at PI 7 and PI 15 (n = 8 for each time point). Mean values ± SD (error bars) are shown. Unpaired t test (two-tailed) was used for the statistical analysis.

