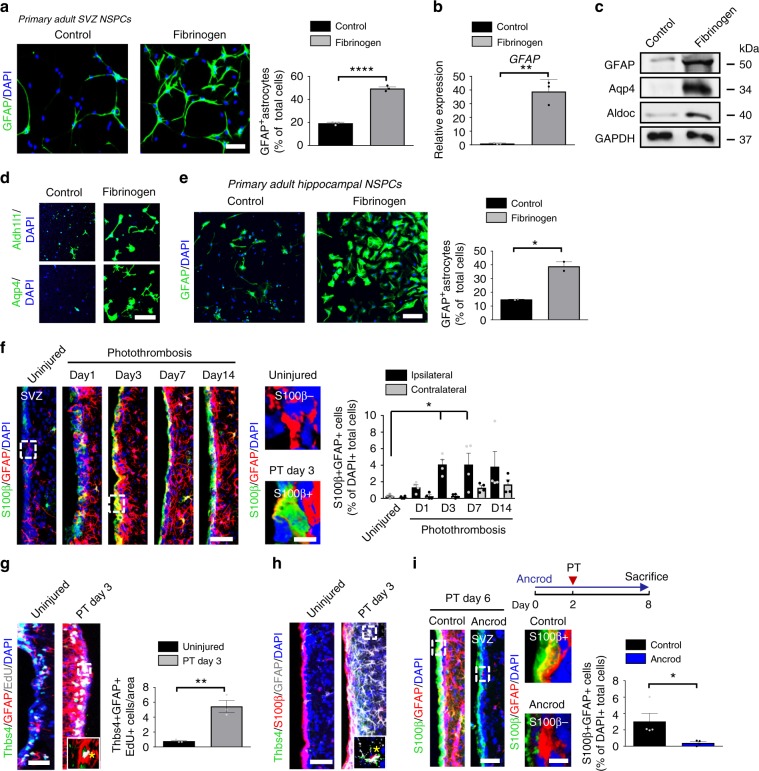
Fig. 2. Fibrinogen-induced differentiation of NSPCs into astrocytes.
a GFAP + astrocytes (green) in untreated and fibrinogen‐treated adult SVZ-derived NSPCs. Scale bar, 56 μm. Quantification of GFAP + astrocytes. (n = 3, mean ± s.e.m, unpaired Student’s t-test, ***P < 0.001). b Expression of GFAP mRNA in NSPCs. (n = 3, mean ± s.e.m, unpaired Student’s t-test, **P < 0.01). c Immunoblot for GFAP, Aqp4, Aldoc, and GAPDH in NSPCs 2 days after fibrinogen treatment. d Aldh1l1 + (green, top) and Aqp4 + (green, bottom) astrocytes in fibrinogen‐treated adult SVZ-derived NSPC cultures. (n = 3, representative images are shown). Scale bar, 67 μm. e GFAP + astrocytes (green) in fibrinogen‐treated hippocampus-derived NSPC cultures. Scale bar, 104 μm. Quantification of GFAP + astrocytes. (n = 2, performed in duplicate, mean ± s.e.m, unpaired Student’s t-test, *P < 0.05. f S100β (green) and GFAP (red) immunostainings in the SVZ at different timepoints after PT. White boxes indicate enlargement of S100β-GFAP + (right, top) and S100β + GFAP + (right, bottom) cells in the SVZ of uninjured and injured (PT day 3) mice, respectively. Scale bars, 40 μm, left and 7 µm, enlargement. Quantification of S100β + GFAP + cells per area (n = 4 mice, mean ± s.e.m, one-way ANOVA and Bonferroni’s multiple comparisons test, *P < 0.05). g EdU (grey), Thbs4 (green) and GFAP (red) immunostainings in the SVZ at 3 days after PT. White box indicates the enlargement of an EdU + GFAP + Thbs4 + DAPI + cell (right, bottom) in the SVZ 3 days after PT. Scale bar, 25 µm. Quantification of Thbs4 + GFAP + EdU + cells in the SVZ per area. (n = 4 mice, mean ± s.e.m, unpaired Student’s t-test, **P < 0.01). h immunolabeling for Thbs4 (green), S100β (red) and GFAP (gray) in the SVZ at 3 days after PT. White box indicating enlargement of a Thbs4 + S100β + GFAP + DAPI + cell in the SVZ 3 days after PT (n = 4 mice). Scale bar, 25 µm. i Scheme illustrating PT on ancrod-administered WT mice (top). S100β (red) and GFAP (green) immunostainings of the SVZ of ancrod-treated mice 6 days after PT. White boxes indicate enlargement of a S100β + GFAP + (top) and a S100β-GFAP + (bottom) cell in the SVZ of control and fibrinogen-depleted mice, respectively, 6 days after PT. Scale bars, 36 μm, left and 7 µm, enlargement. Quantification of S100β + GFAP + cells in the SVZ per area. (n = 4 mice, unpaired Student’s t-test, *P < 0.05). SVZ, subventricular zone.

