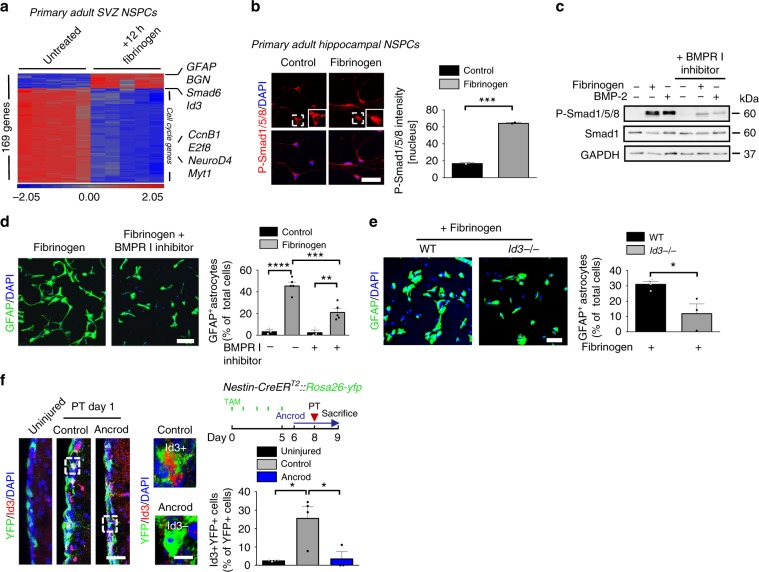
Fig. 3. Fibrinogen induces astrogliogenesis via the BMP–Id3 axis.
a Microarray gene expression profile of NSPCs treated for 12 h with fibrinogen compared to control cells. Heatmap analysis showing genes regulated by a factor of at least 4 between fibrinogen-treated and control NSPCs. (n = 3). b Immunolabeling for phosphorylated Smad1/5/8 (P-Smad1/5/8, red) in fibrinogen-treated hippocampal NSPCs. White boxes indicate enlargement of nuclear P-Smad1/5/8- and P-Smad1/5/8 + cell in untreated and fibrinogen-treated conditions, respectively. Scale bar, 46 μm. Quantification of nuclear P-Smad1/5/8. (n = 2, experiments performed in duplicates (mean ± s.e.m., unpaired Student’s t-test, ***P < 0.001). c Immunoblot for P-Smad1/5/8 and Smad1 in NSPCs pretreated with a BMP receptor inhibitor before fibrinogen stimulation. BMP-2 served as positive control. d GFAP + astrocytes in NSPC cultures pretreated with a BMP receptor inhibitor 1 h before fibrinogen treatment 2 days after initiation of differentiation. Scale bar, 125 μm. Quantification of GFAP + astrocytes. (n = 5, (mean ± s.e.m, one-way ANOVA and Bonferroni’s multiple comparisons test, **P < 0.01, ***P < 0.001, ****P < 0.0001). e GFAP + astrocytes (green) in fibrinogen-treated Id3−/− and WT NSPCs cultures after 2 days on poly‐D‐lysine. Scale bar, 72 μm. Quantification of GFAP + astrocytes. (n = 4, WT; n = 3, Id3−/− cells, mean ± s.e.m, unpaired Student’s t-test, *P < 0.05). f Experimental setup for photothrombosis on Nestin-CreERT2::Rosa26-yfp mice. TAM: tamoxifen (right, top). Id3 (red) and YFP (green) immunostainings in the SVZ of uninjured mice and of ancrod-treated mice compared to control WT mice 1 day after PT. The white boxes indicate the enlargement of an Id3 + YFP + (right, top) and an Id3-YFP + (right, bottom) cell in the SVZ of control mice and fibrinogen-depleted mice, respectively, 1 day after PT. Scale bars, 30 μm, left and 8 µm, enlargement. Quantification of Id3 + YFP + cells in the SVZ per area. (n = 4 uninjured mice, n = 4 control mice after PT, n = 3 ancrod mice after PT, unpaired Student’s t-test, *P < 0.05).

