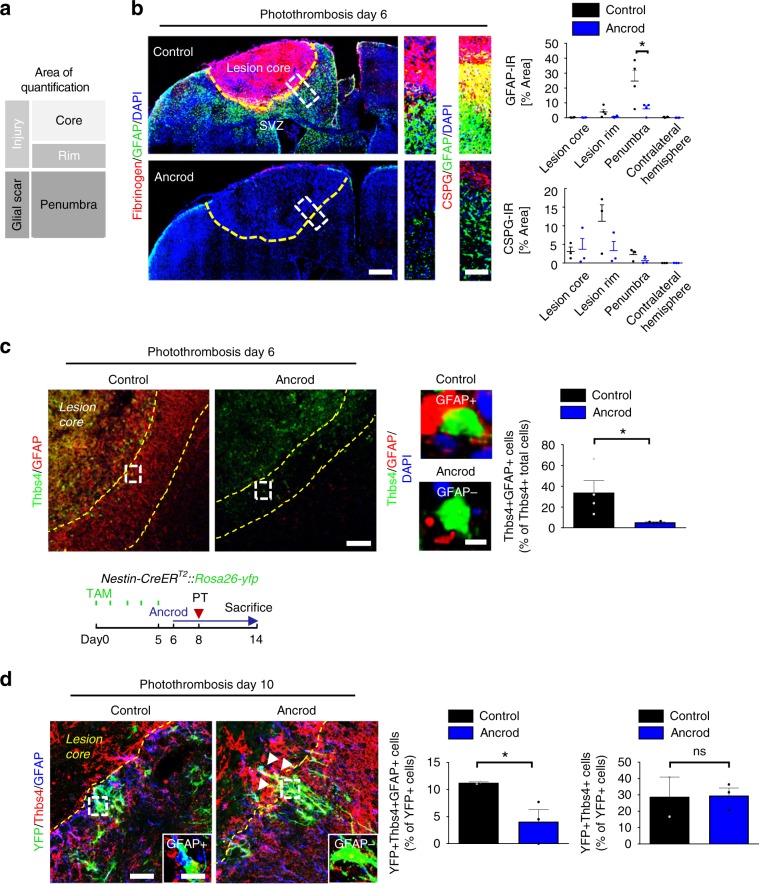
Fig. 5. Fibrinogen-induced SVZ astrocytes add to cortical scar.
a Representation of the different lesion regions quantified by immunoreactivity. b Fibrinogen deposition (red) and GFAP + astrocytes in the brain of fibrinogen-depleted mice (Ancrod) compared to controls (NaCl) at 6 days after PT (left). Yellow dotted line delineates the lesion area. The white boxes indicate the enlargement of the lesion region quantified for GFAP (right, top) and CSPGs (right, bottom) immunoreactivities. Quantifications of GFAP and CSPG immunoreactivities in the different lesion regions (n = 4 mice, mean ± s.e.m, one-way ANOVA and Bonferroni’s multiple comparisons test, *P < 0.05). c Immunolabeling for Thbs4 (green) and GFAP (red) in the lesion area of ancrod and control mice at 6 days after PT. Yellow dotted lines delineate the penumbra. The white boxes indicate the enlargement of a Thbs4 + GFAP + cell (top, right) in controls and Thbs4 + GFAP- cell in ancrod mice (right, bottom). Quantification of Thbs4 + GFAP + astrocytes in the penumbra of ancrod and control mice (n = 4 mice, mean ± s.e.m, unpaired Student’s t-test, *P < 0,05). d Experimetal setup for ancrod-administered Nestin-CreERT2::Rosa26-yfp mice. TAM: tamoxifen (top). YFP (green), Thbs4 (red) and GFAP (blue) immunostainings in the lesion area of ancrod and control mice at 10 days after PT. Yellow dotted lines delineate the lesion area. The white boxes indicate the enlargement of an YFP + Thbs4 + GFAP + cell in control and YFP + Thbs4 + GFAP- cell in ancrod mice. Quantifications of YFP + Thbs4 + GFAP + astrocytes (left) and YFP + Thbs4 + cells (right) in the penumbra of ancrod and control mice (n = 2 control mice, n = 3 ancrod mice, unpaired, one-tailed Student’s t-test, *P < 0,05, ns, not significant). SVZ subventricular zone.

