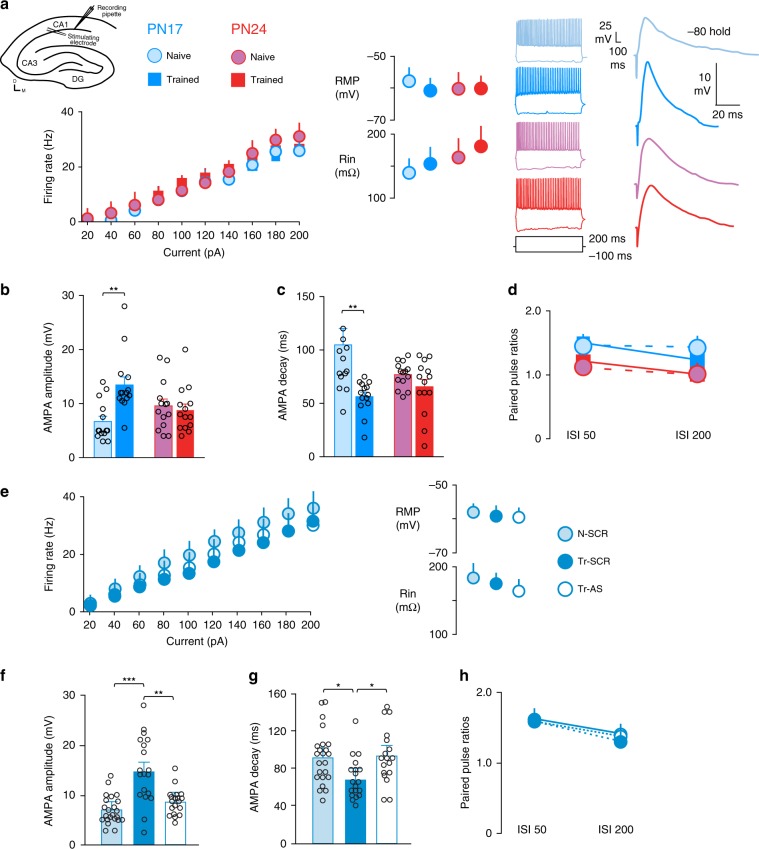
Fig. 3. Learning-induced changes in AMPA receptor responses at PN17 require the expression of PSD-95.
a Diagram shows where whole-cell recordings were carried out in hippocampal slice preparations, and where a biphasic stimulator was placed to evoke AMPAergic responses. From left to right: intrinsic excitability data showing the effect of training at PN17 or PN24 on firing rate, resting membrane potential and membrane input resistance, representative traces of hippocampal pyramidal neurons following positive and negative current injection into the cell, and representative traces from the same cells showing evoked AMPA receptor potentials. b, c AMPA receptor potential amplitude (b) and decay time (c) after training at PN17 and PN24. d Paired-pulse ratios after training at PN17 and PN24. Sample size for a–d, each group, n = 14 cells obtained from three male rats per age. **P < 0.01 (two-way ANOVA followed by Bonferroni’s multiple comparisons test). e Recordings were obtained from naive (N) and trained (Tr) rats, which received two hippocampal injections of scrambled (SCR) or PSD-95-antisense ODN (AS), the first immediately after training at PN17 and the second 6 h later. Rats were euthanized 24 h after training (i.e., PN18). These recordings were conducted in slices immediately in front of and behind the slice containing the cannula implant site. From left to right: Intrinsic excitability data showing the effect of training at PN17 and PSD-95 AS-ODN injections on firing rate, resting membrane potential, and membrane input resistance. f, g The effect of PSD-95 AS-ODN or SCR-ODN injections following training at PN17 on AMPA receptor potential amplitude (f) and decay time (g). h The effect of PSD-95 AS-ODN or SCR-ODN injections following training at PN17 on paired-pulse ratios. Sample size for e–h, N-SCR, n = 23 cells; Tr-SCR, n = 19 cells; Tr-AS, n = 18 cells; obtained from three male rats per group. *P < 0.05, **P < 0.01, ***P < 0.01 (one-way ANOVA followed by Tukey’s multiple comparisons test). For detailed statistical information, see Supplementary Tables 5–6.

