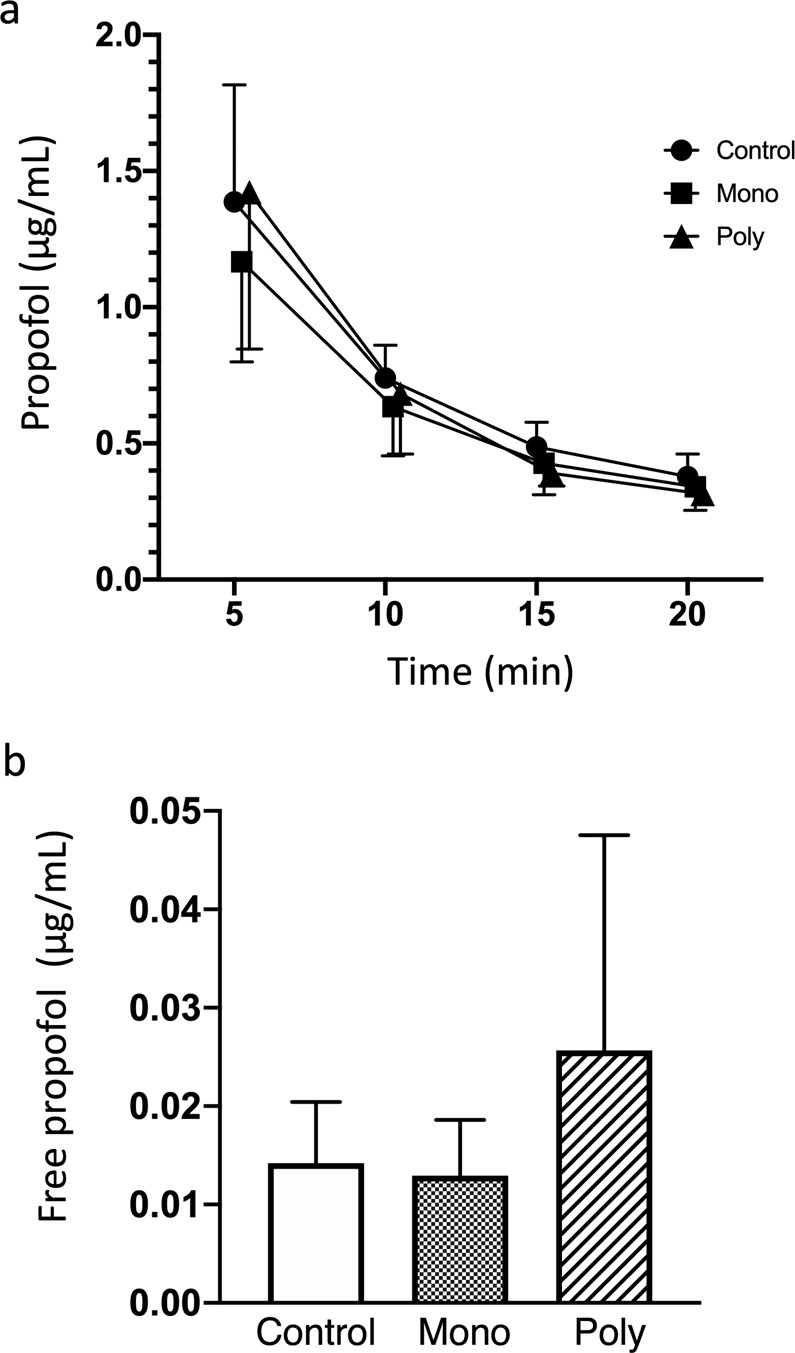
Figure 1.

The effects of mono-VPA and poly-VPA therapy on the pharmacokinetics of propofol. The graphs show the blood levels of propofol at 5, 10, 15, and 20 min after the administration of propofol (a) and the concentration of protein-unbound free propofol at 5 min after the administration of propofol. (b) There were no significant differences among the 3 groups. However, the protein-unbound free propofol level tended to be higher in the poly-VPA group. Mixed-effect analysis was employed for the analysis of propofol blood levels, and one-way ANOVA with Tukey’s multiple comparisons test were used to analyze the concentration of protein-unbound free propofol. Data are presented as mean ± standard deviation (SD) values. Control: control group, Mono: mono-VPA group, Poly: poly-VPA group.
