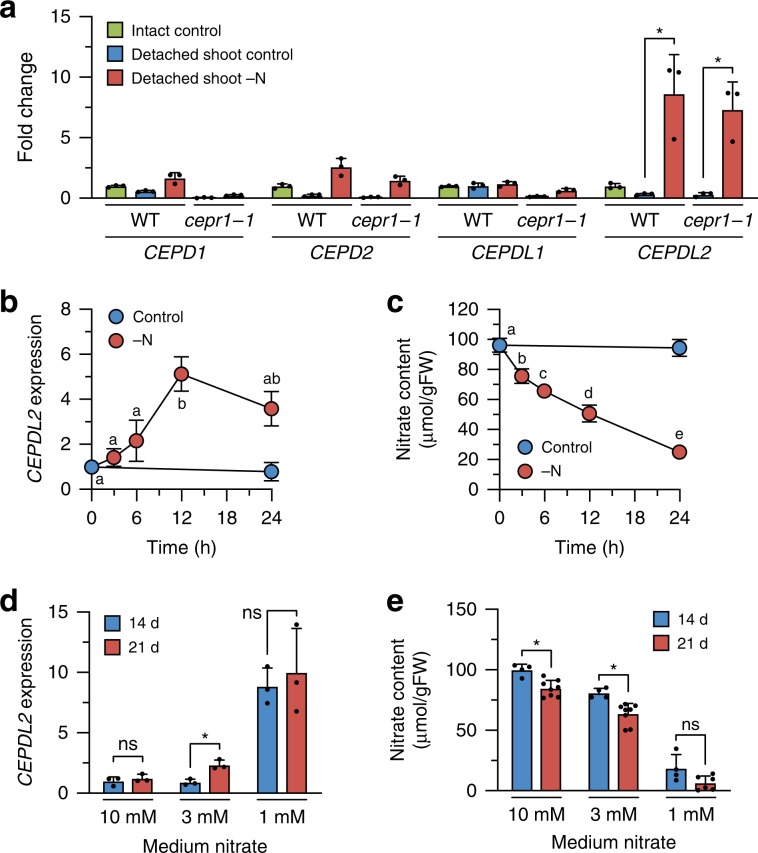
Fig. 3. CEPDL2 expression is directly regulated by the N status of the shoots.
a qRT-PCR analysis of CEPD1/2 and CEPDL1/2 transcripts in the detached leaves of 12-day-old WT and cepr1-1 plants after N starvation for 24 h (n = 3). b Changes in CEPDL2 transcript levels in WT shoots subjected to N starvation for up to 24 h (n = 3). Different letters indicate statistically significant differences (P < 0.05, one-way ANOVA, n = 4). c Changes in nitrate content in WT shoots subjected to N starvation for up to 24 h (n = 4). d Levels of CEPDL2 transcripts in WT shoots grown for 14 or 21 days under various nitrate conditions (n = 3). e Nitrate content in WT shoots grown under various nitrate conditions (n = 8).

